LEGACY POST: This is a legacy blog post. Net Drag Reduction Value has been replaced by Total Power. Total Power uses Net Drag Reduction Value. This post also discusses old generations of wheels.
We’ve always believed in trying to be as realistic as possible when estimating time savings for a given wheel. To do this we use our Net Drag Reduction Value equation. If you’re wondering what the Net Drag Reduction Value equation is, you’ve come to the right place.
Setting A Baseline for Net Drag Reduction Value
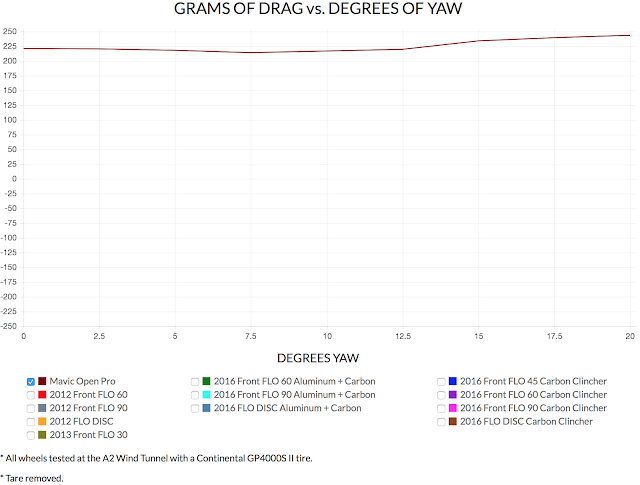
When you calculate time savings, you have to use a baseline wheel to compare other wheels against. At FLO, we use a Mavic Open Pro, with 32 round spokes. In the graph below, you can see the grams of drag produced by the Mavic Open Pro for specific yaw angles. If you’d like to learn more about yaw versus drag graphs, please check out this tutorial on aero wheels.

How to Calculate Time Savings the Wrong Way
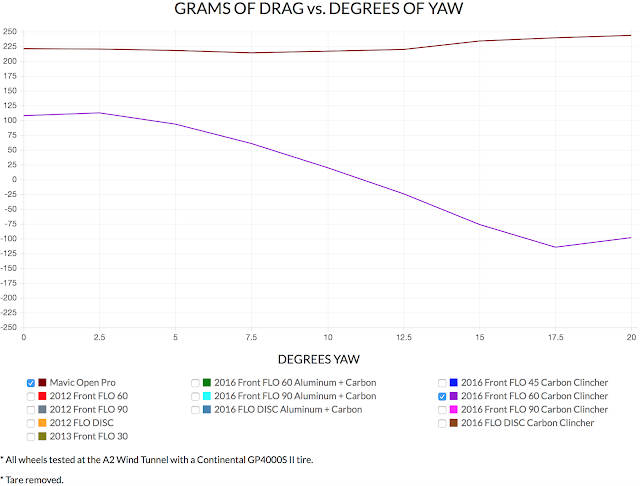
Once you set the baseline, you compare other wheels to this baseline. The example below shows our FLO 60 Carbon Clincher.

Let’s look at 17.5 degrees of yaw. For the Mavic Open Pro, the grams of drag are 239.5 grams and the FLO 60 Carbon Clincher produces -114.5 grams. This is a difference of 354 grams and the largest difference anywhere in the yaw versus drag graph.
We know reducing drag by 100 grams saves you approximately 40 seconds over a distance of 40 kilometers. (Check out the math behind why 100g saves you 40 seconds over a 40km). If we were to use the largest difference of 354 grams, we would say that the wheel saved you roughly 142 seconds or 2 minutes 22 seconds over a distance of 40 kilometers. This would translate to roughly 637 seconds or 10 minutes 37 seconds over an Ironman. While this is impressive, it’s wrong. The reason this is wrong is because you do not spend 100 percent of your time riding at 17.5 degrees of yaw.
How to Calculate Time Savings the Right Way
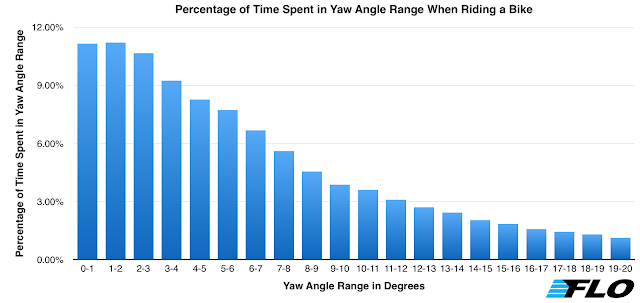
In order calculate time savings the right way, you have to know which yaw angles a rider experiences and the percentage of time they spend at those yaw angles.
We’ve studied this extensively and over a course of time collected 110,000 data points. The graph below shows what we found after analyzing the data. Feel free to learn more about how we collected the data and analyzed the data.

Now that we know what yaw angles a rider experiences and for how long, we can calculate the weighted average time savings using the Net Drag Reduction Value equation. Here’s how we do it.
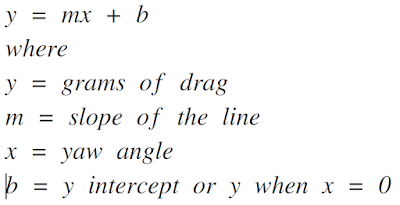
In the wind tunnel we measure drag at 0, 2.5, 5.0, 7.5, 10.0, 12.5, 15.0, 17.5 and 20.0 degrees of yaw. The Net Drag Reduction Value Equation uses the average drag experienced between two yaw angle. For example, the average drag between 0 and 1 degree of yaw is the drag value at 0.5 degrees of yaw. Since we did not measure the value at each .5 degree of yaw, we use the equation of a line to solve for these the values. The equation of a line is shown below.

As an example I will show how to calculate the average drag between 0 and 1 degree of yaw for the FLO 60 Carbon Clincher. The first thing we have to do is solve for the slope.

Rise is the difference in the drag values measured at 2.5 degrees of yaw and 0 degrees of yaw for the FLO 60 Carbon Clincher. Looking at the yaw versus drag graph above, we can see the drag values at 2.5 and 0.0 degrees of yaw are 112.2 grams and 107.9 grams, respectively.
Run is the difference between the yaw angles. The two yaw angles used are 2.5 and 0.0, so the difference between them is 2.5. This gives us a slope of 1.88.
Next we need the b, or the y intercept. The y intercept is the value of y at X1. This value is 107.9 grams.

Now we can use the equation of a line to solve for the drag value at 0.5 degrees of yaw.

Once we know the drag value at 0.5 degrees of yaw, we can multiply the value by the percentage of time spent between 0 and 1 degree of yaw. From the graph above, we can see that a rider spends 11.15 percent of their time in the range.

Once we calculate this value for all of the yaw angles between 0 and 20 degrees, we can add them together to get a weighted average drag value for a specific wheel.
Using the weighted average drag value for our baseline wheel, the Mavic Open Pro, we can compare this value to the same value of any other wheel. For example, the weighted average drag values of the Mavic Open Pro and our FLO 60 Carbon Clincher are 220.4 grams and 64.1 grams, respectively. This means that on average, a rider will experience 64.1 grams of drag when riding a FLO 60 Carbon Clincher verse 220.4 grams on a Mavic Open Pro. Therefore, the Net Drag Reduction Value is the difference between the baseline wheel, the Mavic Open Pro, and the wheel you are comparing it to: the FLO 60 Carbon Clincher.

The Net Drag Reduction Value gives an accurate estimate of the time savings a wheel will give you. Over a distance of 40 kilometers, you would save roughly 63 seconds or 1 minute 3 seconds and over an Ironman, you would save roughly 281 seconds or 4 minutes 41 seconds. This is much different than the 10 minutes 37 seconds we saw above.
Final Thoughts
Since we know that most of our time on a bike is spent at low yaw angles, the key to a fast cycling wheel is being aerodynamic at shallow yaw angles. Yaw versus drag graphs can get confusing quickly, especially if one wheel looks faster because at steep yaw angles it has a lower drag value. Make sure you consider a Net Drag Reduction Value when you are picking your next wheel set. It’s the only way to get an accurate estimate on the time the wheel will save you.
Another thing to note is that your baseline is the wheel you are coming from. Your wheel may be more or less aerodynamic than the Mavic Open Pro.
Finally, we test wheels independently in the wind tunnel. On the road, you and the bike are in the picture. This changes the way the air interacts with the wheels—especially the rear wheel—and changes the aerodynamics. While our estimates are not perfect, they do give you a good idea of your time savings. If you are interested in selecting wheels for your bike based on reducing drag, I recommend getting fit in the wind tunnel. It isn’t cheap, but it’s really beneficial and a very cool experience.

Co-founder at FLO Cycling. Jon manages the day to day operations and acts as the lead engineer for all FLO products.
