
Legacy Article: The data discussed in this article is taken from our previous generation of wheels.
In 2014 we sat down to redesign our FLO Cycling wheel line. This five-step design process took 15 months to complete and this blog series covers the design process in detail. This is Step 2 of our five-step design process. To learn more about Steps 1, 3, 4, and 5, please check out the links below.
Step 2 – Data Analysis
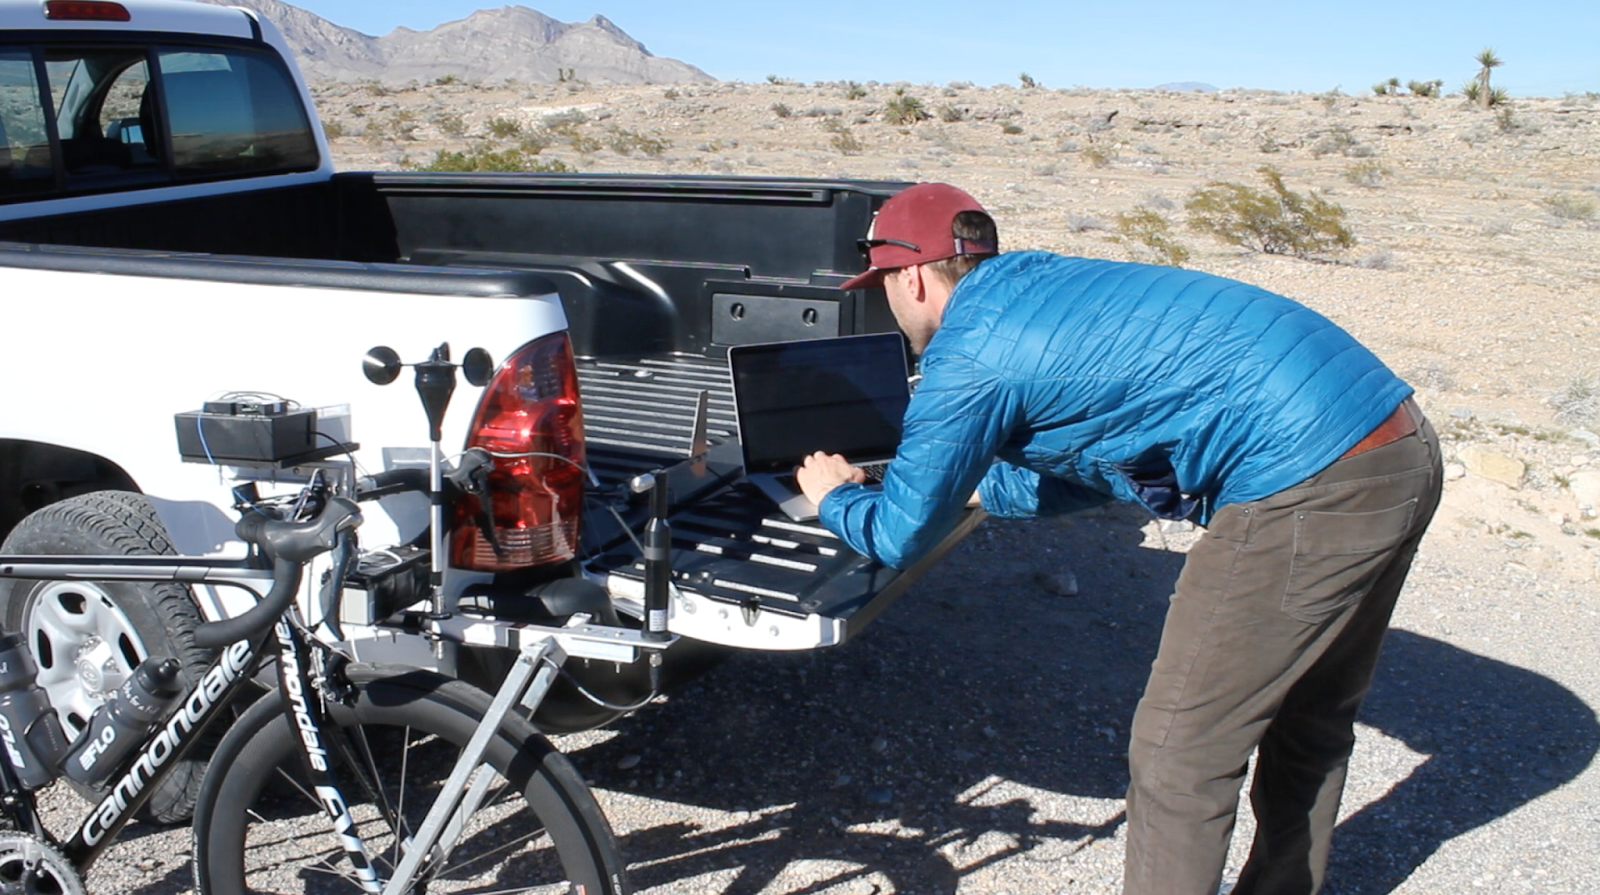 |
| Analyzing Data After a Ride |
Why Did we Analyze the Data?
In Step 1 of this series, we discussed how we collected real-world data while riding on a variety of Ironman courses and in different riding scenarios. In total, we collected a combined 110,000 yaw-angle and relative-velocity measurements using our custom data logger. Our hope was that we would find consistent patterns in the data that would help us design faster cycling wheels.
How Did we Analyze the Data?
When analyzing the data, we focused on four main areas to find useful patterns for design.
1. Relative Velocity, Yaw Angle, and Time Relationships
By studying the relationships below, we were able to get a good understanding of how wind interacts with a cyclist while riding. We sorted the data two ways:
First, we sorted the data by relative velocity using a range of one mile per hour. For example, all measurements between three and four miles per hour were considered. With the data sorted by relative velocity, we studied the average yaw angle and the percentage of time spent in each individual range.
The second way the data was sorted was using a yaw angle range of one degree. For example, we looked at all measurements between zero and one degree of yaw. With the data sorted by yaw angle, we studied the average relative velocity and the percentage of time spent in each individual range.
2. How Does Wind Data Vary from Ride to Ride?
What happens when you ride along the coast at Ironman 70.3 Oceanside? How does that change when you are riding an inland course like Ironman 70.3 Silverman? What happens when you are in a draft? We had a detailed look at each individual ride to determine if there were differences that needed to be accounted for. To recap from Step 1, here are the courses and the scenarios we used as testing sites.
Ironman Courses
Ironman 70.3 Silverman
Ironman 70.3 St. George
Ironman 70.3 Oceanside
Ironman World Championships in Kona (partial course).
Riding Scenarios
Descending
Climbing
Coastal riding
Wooded areas
Drafting
Sprinting
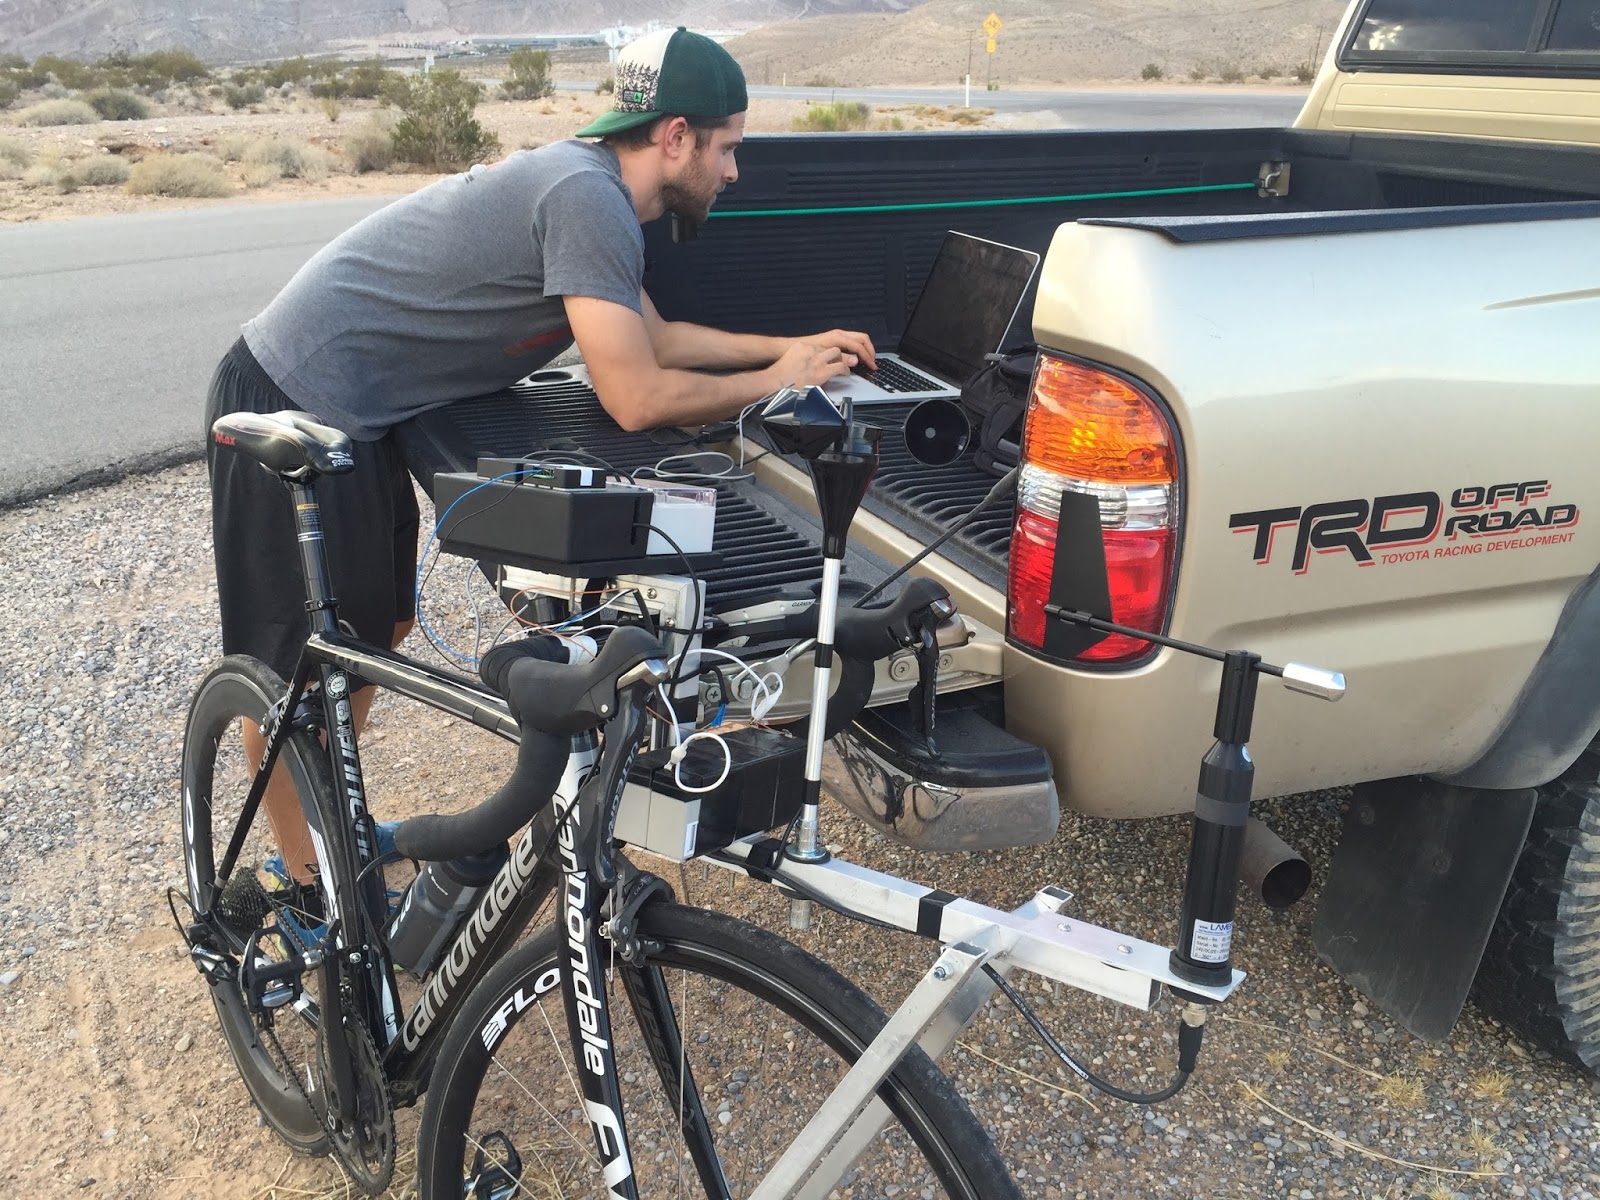 |
| Analyzing Data After a Series of Descents |
3. Video Analysis
GoPro footage was used to compare measurements with the environment. As an example, if we found a really large yaw angle reading that lasted for less than a second, what caused that to happen? The video below shows GoPro footage from one of our rides.
4. Identify Outliers
In most data sets, there are outliers that can be ignored with the intent of producing better results. As an example, riding with a relative velocity of zero miles per hour allows the yaw angle sensor to spin freely because it is not being affected by the wind. These random yaw angles measured during this time period are useless data because in a zero mile per hour relative velocity situation, you have no aerodynamic drag. In this case, eliminating these readings from the data yields better overall results.
What Did We Find?
Cleaning Up the Data
After analyzing all of the data, we determined:
1. Ride data for all rides showed a very consistent pattern. Because of the overwhelming similarities, we decided to combine all ride data together for the rest of our analyses. Were there differences between coastal rides, inland rides, climbing, and descending? Yes, but they were so small that trying to separate them in an attempt to design better wheels would have been unreasonable.
2. Measurements with a relative velocity of less than three miles per hour were very inconsistent and produced unreliable results. Therefore, all measurements recorded with a relative velocity of less than three miles per hour were excluded from the data set.
3. Yaw angle measurements greater than 20 degrees were removed from the data set. Yes, you will see the odd yaw angle measurement greater than 20 degrees, but they occur for a very short period of time (typically less than one second) and were produced by one of the following scenarios:
- The rider being passed by a car.
- The rider being hit with a gust of wind after passing a structure.
- The relative velocity reading was low typically less than one mile per hour.
- The yaw sensor was stabilizing after experiencing any of the above three scenarios.
4. In the end we considered all measurements that had a yaw angle between -20 and 20 degrees of yaw, and that had a relative velocity of greater than three miles per hour. This new data set accounted for 100 percent of our riding time.
The Results
The graph and table below show the percentage of time a rider spends in a yaw angle range. For example, a rider spends 11.15 percent of their time between zero and one degree of yaw. Note: All negative yaw angle measurements are included in the ranges below.
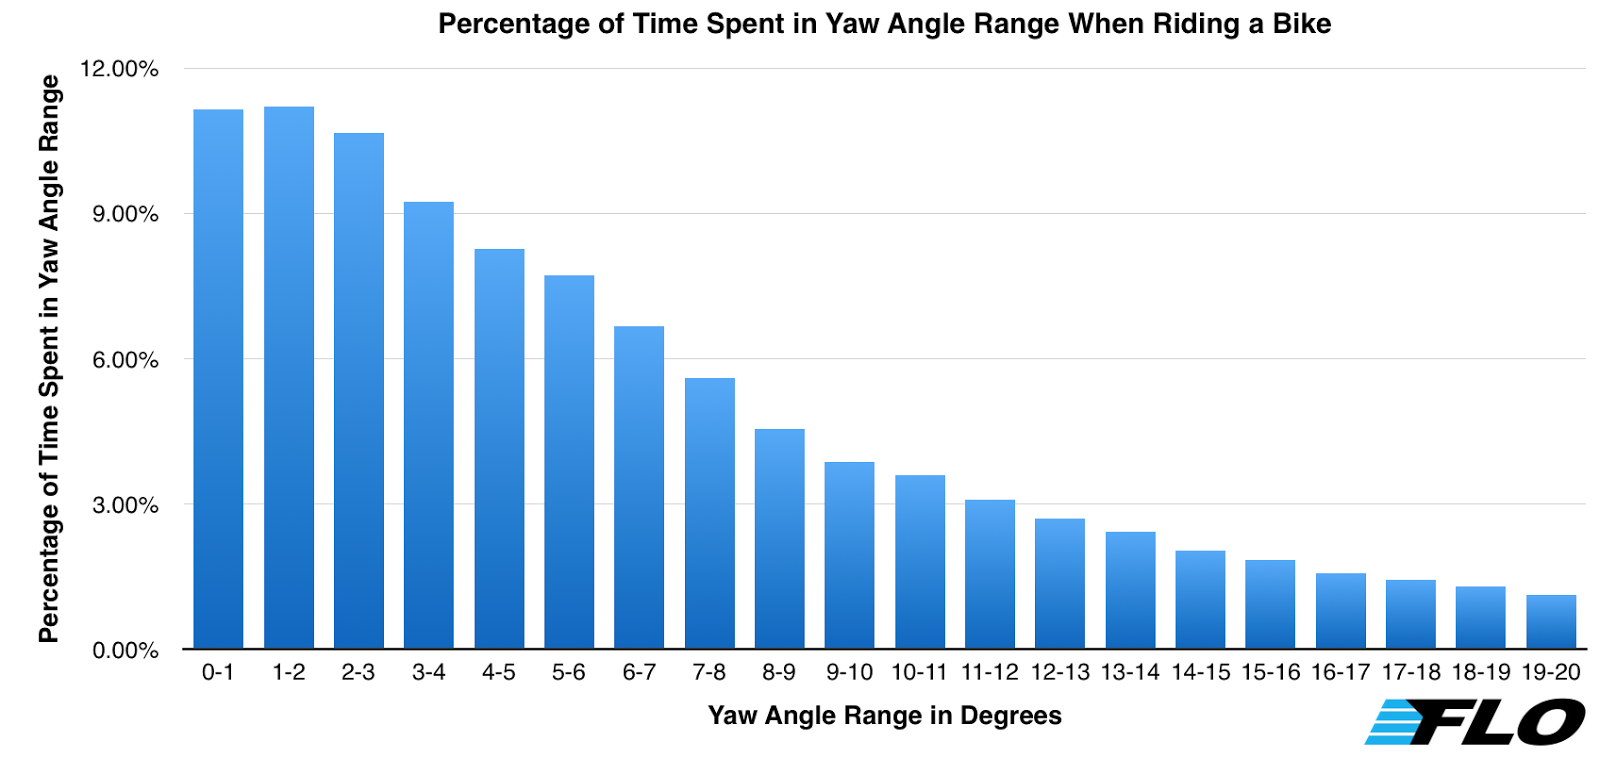 |
| Percentage of Time Spent in a Yaw Angle Range When Riding a Bike |
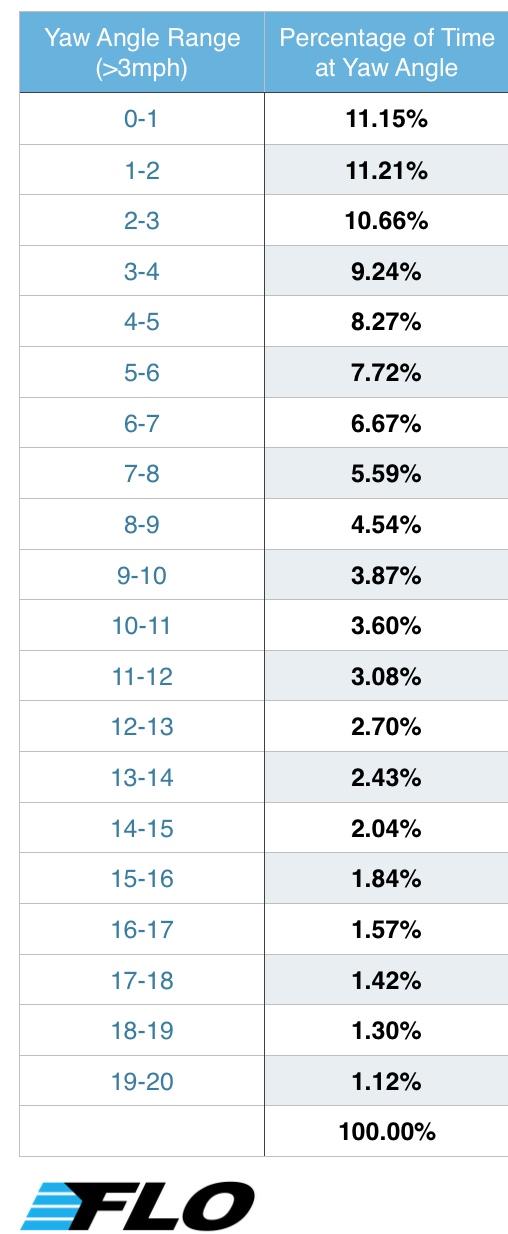 |
| Percentage of Time Spent in a Yaw Angle Range When Riding a Bike |
Key Design Patterns Discovered
After our analysis, we discovered that there were some very useful patterns that we could use to design our next line of aerodynamic cycling wheels. They were as follows:
- As the yaw angle increases, the percentage of time spent in the corresponding range decreases. The above chart shows this graphically.
- 50 percent of your time on a bike is spent between zero and five degrees of yaw.
- Roughly 80 percent of your time on a bike is spent between zero and 10 degrees of yaw.
- Only about 20 percent of your time on a bike is spent between 10 and 20 degrees of yaw.
- Our old belief was that 80 percent of your time was spent between 10 and 20 degrees of yaw over an even distribution of time. The new results tell the exact opposite story. In reality, 20 percent of your time is spent between 10 and 20 degrees of yaw, and the time spent at each yaw angle decreases as the yaw angle increases.
Before we put this new data to use, we needed to build baseline models for testing. Check out Step 3 of this series, titled 3D Modeling.
Please let us know if you have any questions about the article. We’d be happy to answer them for you.
Co-founder at FLO Cycling. Jon manages the day to day operations and acts as the lead engineer for all FLO products.