
Legacy Article: The data discussed in this article is taken from our previous generation of wheels.
Step 1 – Data Collection
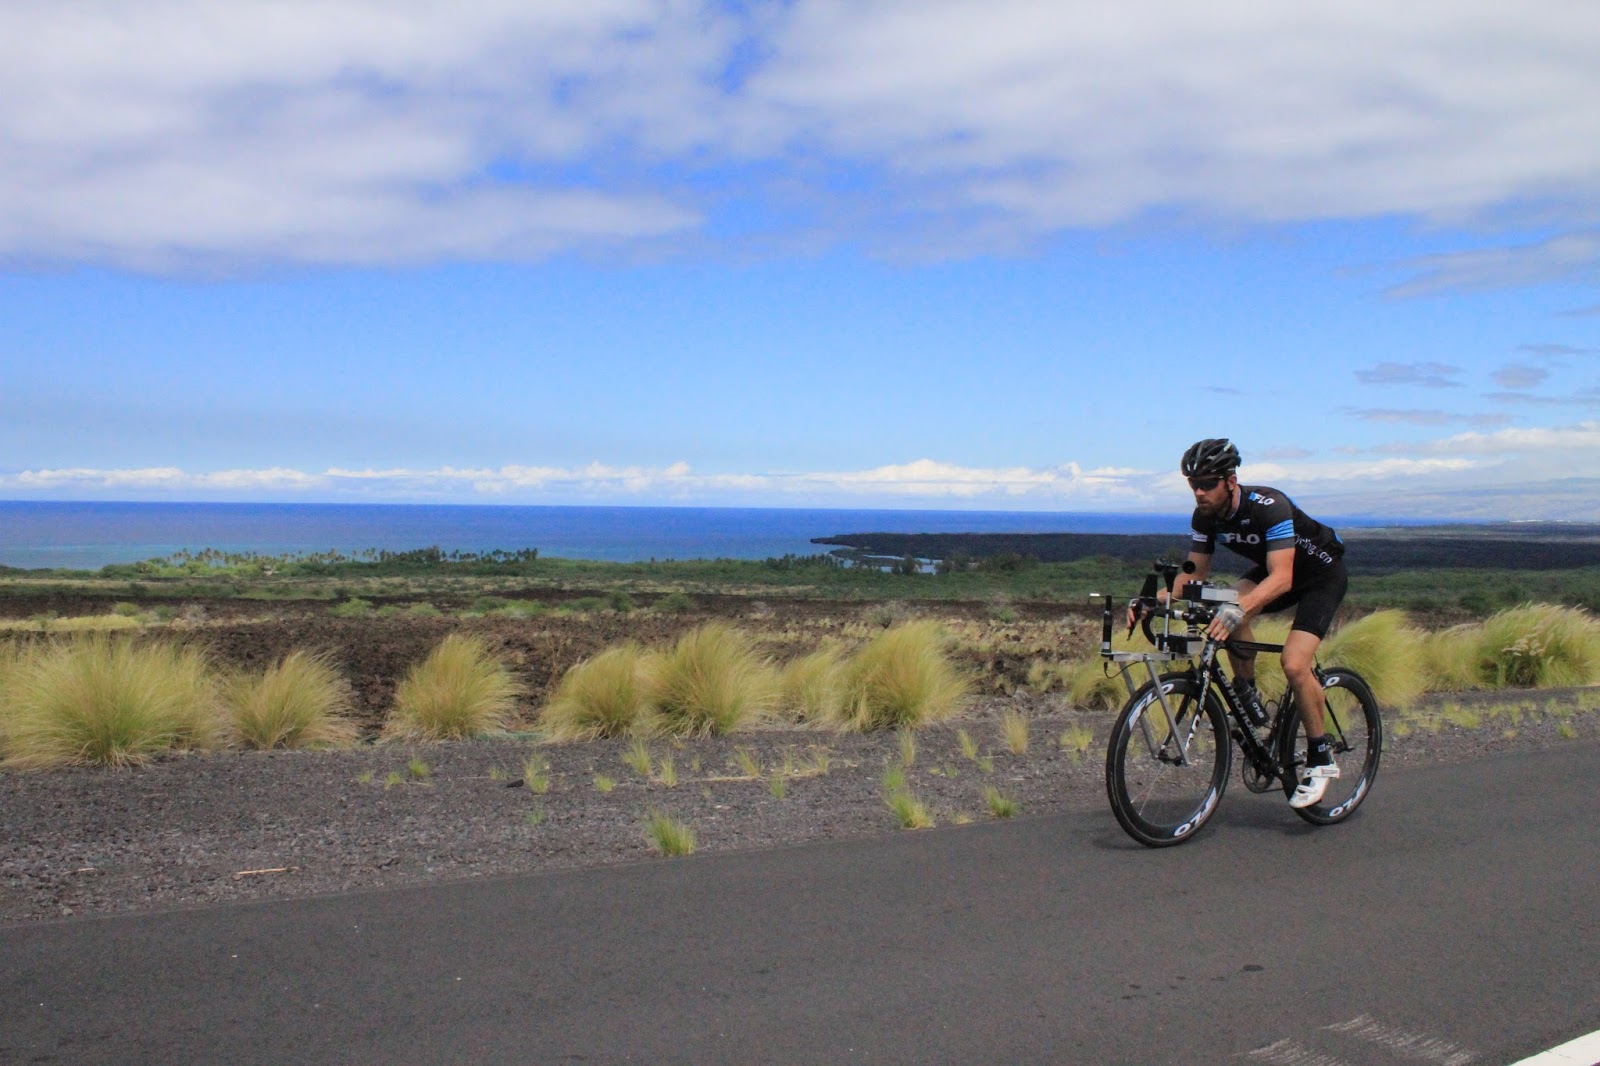 |
| Collecting Data on the Ironman World Championship Kona Course |
How can you design an aerodynamic cycling wheel if you don’t know how the cyclist interacts with the wind while riding? The short answer is that you can’t. There have been several theories about average yaw angles. Some studies have suggested that average yaw angles are relatively shallow, 10 degrees and below, while others have suggested that a cyclist spends 80 percent of their time between 10 and 20 degrees of yaw.
Our 2012 wheel line was designed around the theory that suggested higher yaw angles. Before we began working on redesigning our wheel line, we knew we needed to gain a full understanding of what actually happens while on the road. We also needed to understand what happened in specific riding scenarios such as riding along the coast, drafting, climbing, and descending.
How Did We Collect Data?
In order to collect real-world data, we needed to build a device that could record live wind data while riding. Not only did the sensor have to be accurate, it needed to be precise, and it needed to collect measurements at a high enough frequency to make the data useful. Our data-collecting device was comprised of three key components that were assembled together. Those components are as follows.
Data Logger
A data logger is a computer that records measurements from sensors. We chose the Onset Hobo Micro Station Data Logger for the following reasons:
- It records at a high frequency (one second)
- It has good accuracy (Zero to two seconds for the first data point and ±five seconds per week at 25°C (77°F))
- It was small
- It allowed us to connect our own custom sensors
Please feel free to check out the full specifications on the Onset Hobo Micro Station Data Logger.
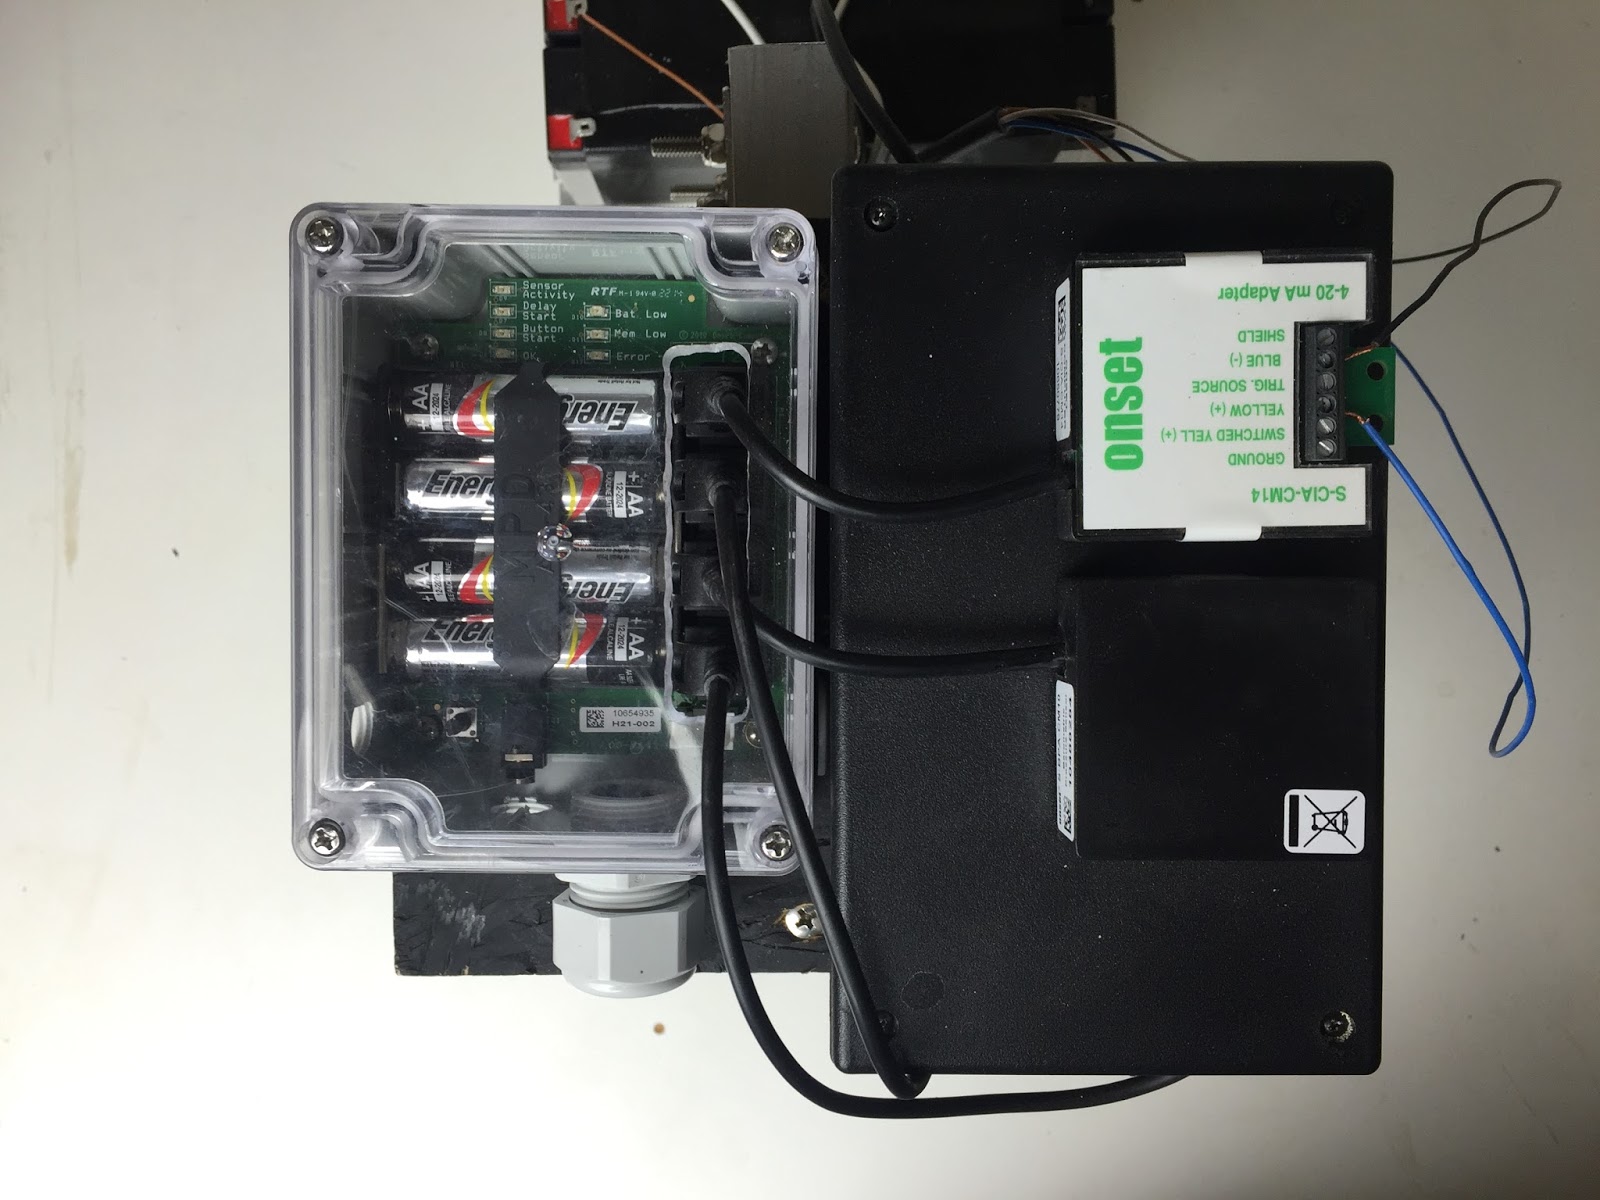 |
| Data Logger Mounted and Wired Up |
Yaw Angle Sensor
A yaw angle sensor measures the angle of the wind interacting with the cyclist. As an example, if the wind was blowing directly at you from the front of your bike, your yaw angle would be zero degrees. If the wind was hitting you directly on your right-hand side, the yaw angle would be 90 degrees. Finding a yaw angle sensor with a high enough accuracy and low enough resolution ended up being quite challenging. In the end, we had to special order the Lufft Wind Sensor Professional Model 14521 from a company in Germany, that ended up being worth more than the high-end carbon bike it was on. Here are some of the key specifications on the yaw angle sensor.
- Output: 4-20mA
- Accuracy: +/- one degree
- Resolution: Less than one degree
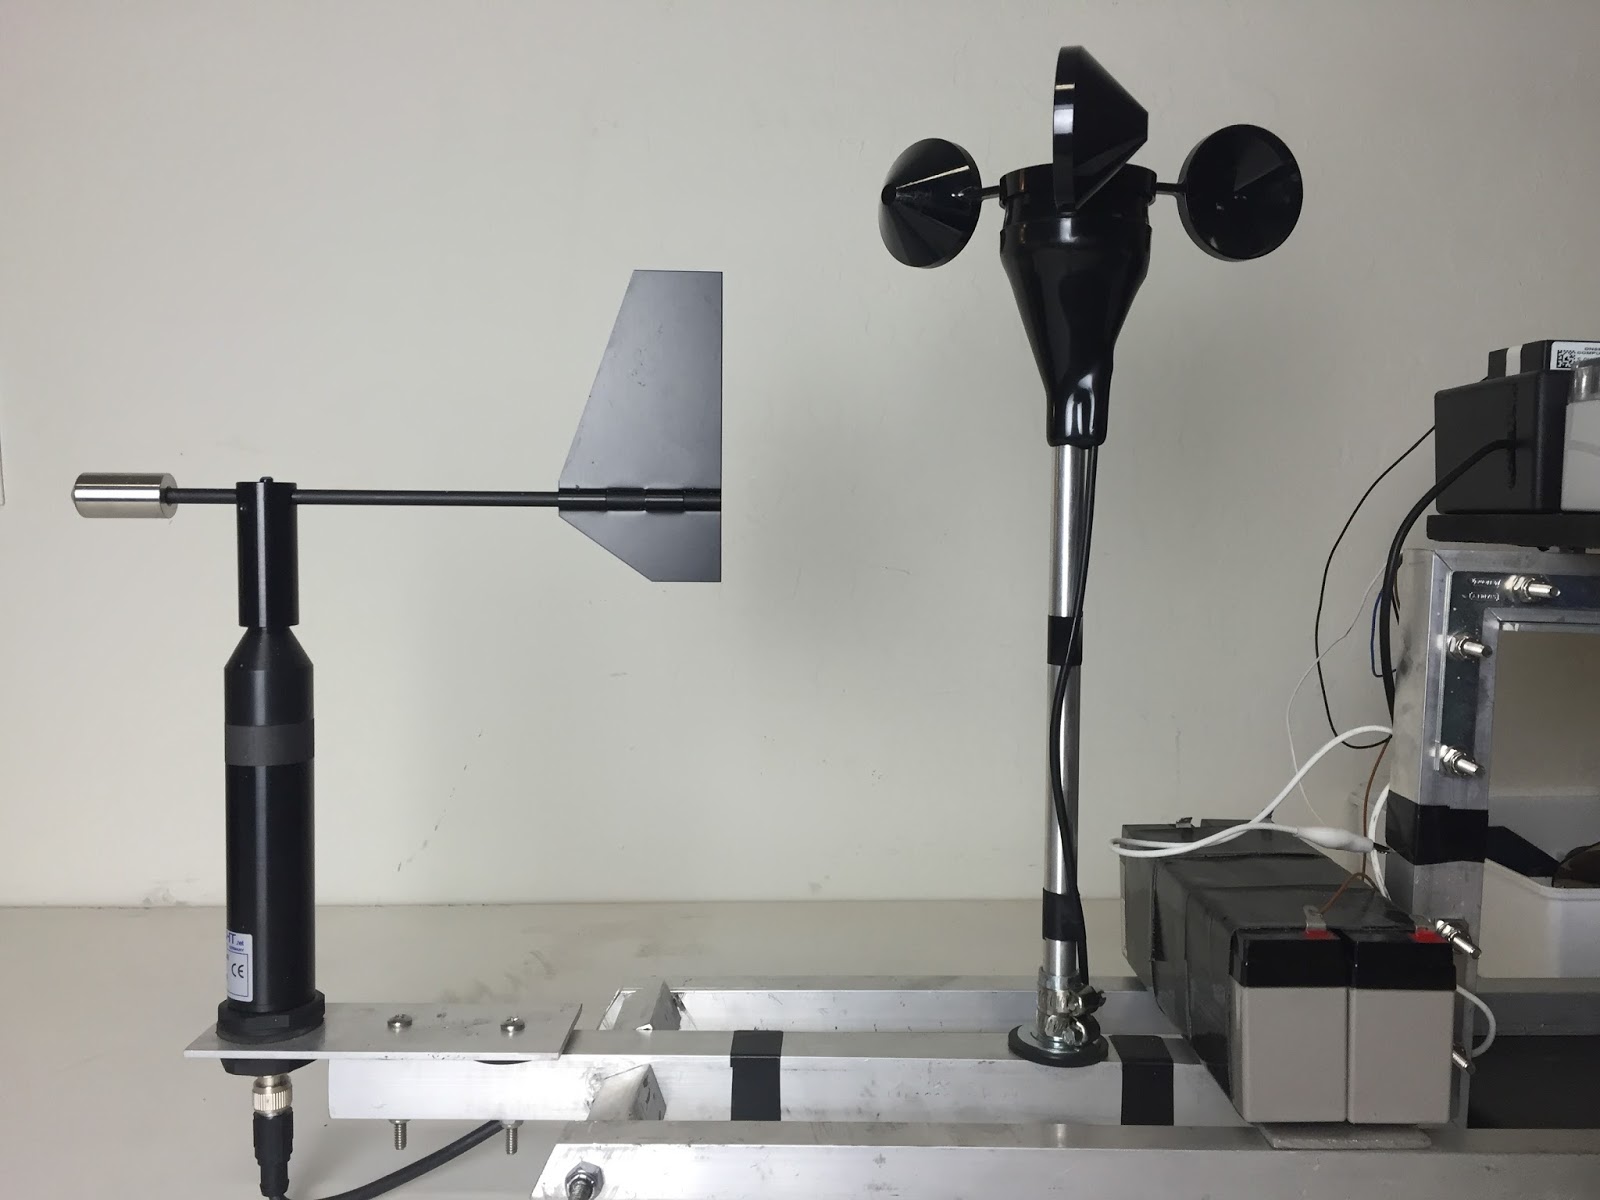 |
| Yaw Angle Sensor, Relative Velocity Sensor, and Batteries |
Relative Velocity Sensor
A relative velocity sensor measures the speed of the wind interacting with the cyclist. Many people believe that the speed of their bicycle is the speed of the wind, but this is not true. Here are two examples: if you are riding at 20mph into a 10mph headwind, your relative velocity is 30mph; if you are riding at 20mph with a 10mph tailwind, your relative velocity is 10mph. To record relative velocity, we chose the Onset Wind Speed Smart Sensor S-WSB-M003 for this task.
Please feel free to check out the full specification on the Onset Wind Speed Smart Sensor S-WSB-M003 Relative Velocity Sensor.
Completed Data Logger
Here are a couple of shots of the completed data logger before it was mounted to a bike.
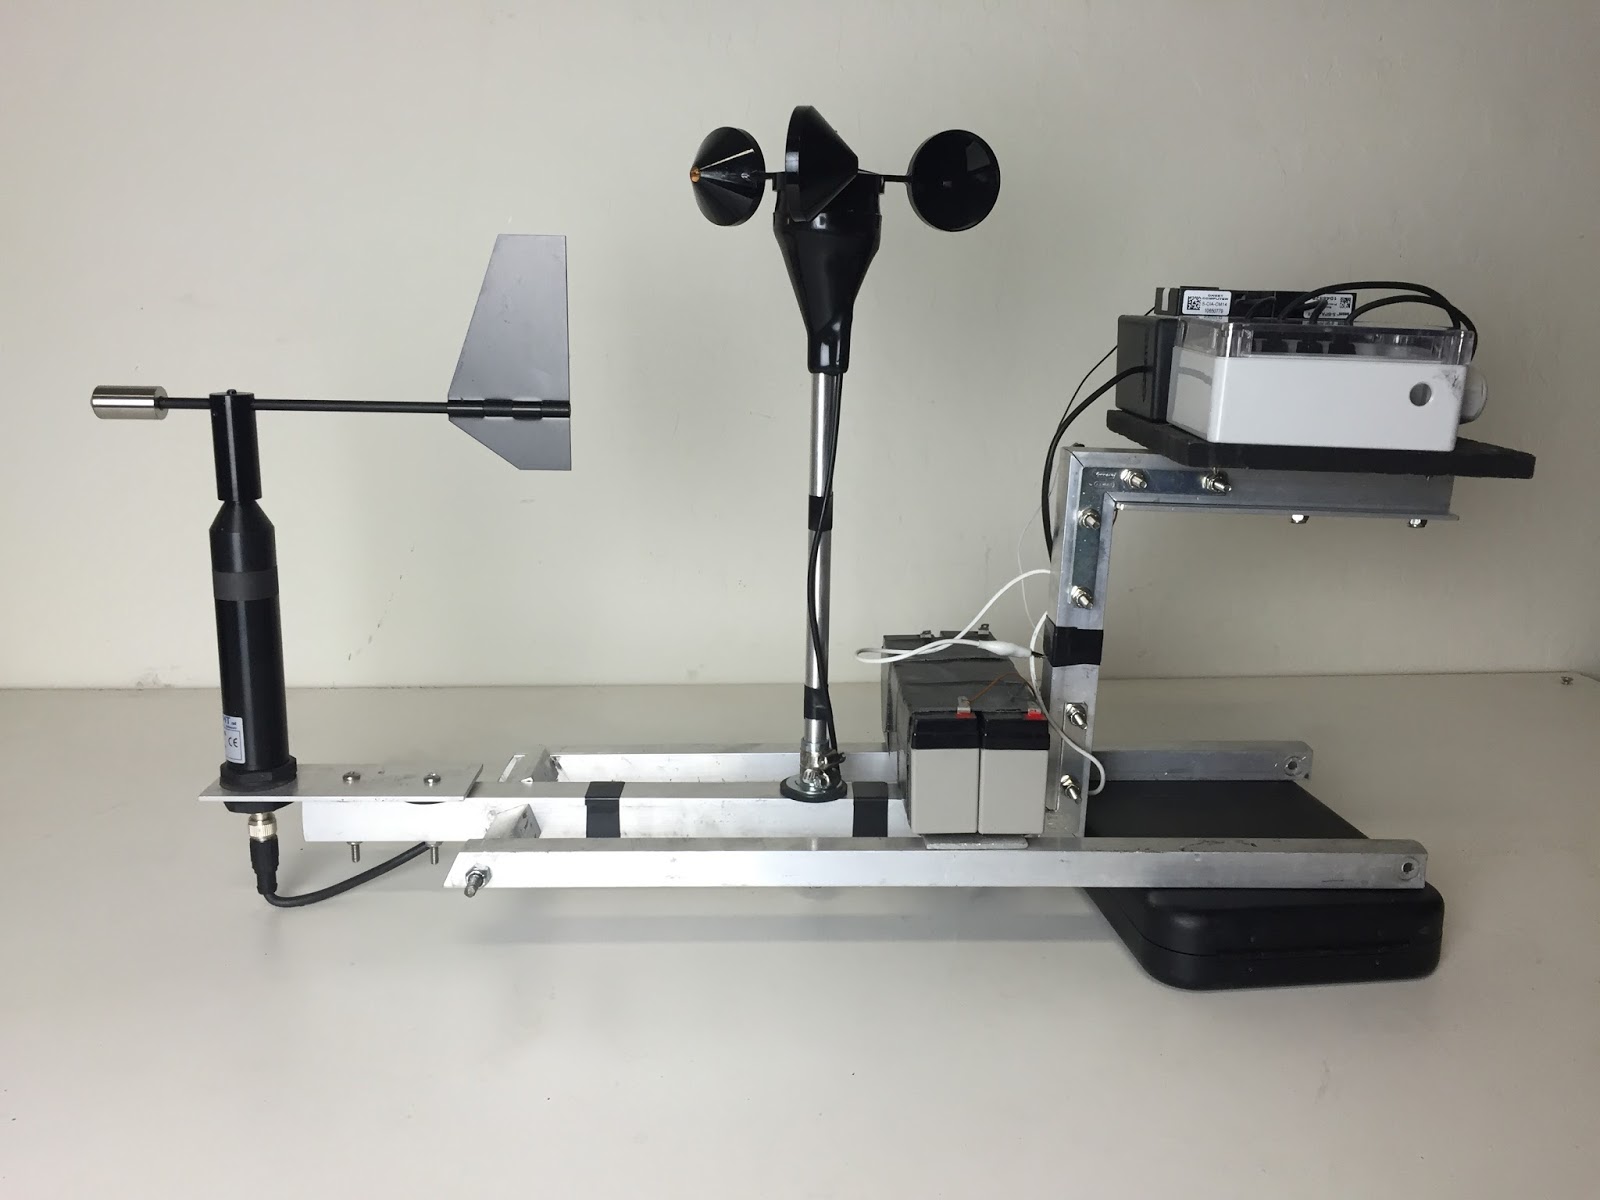 |
| Complete Data Logger Before it was Mounted to a Bike |
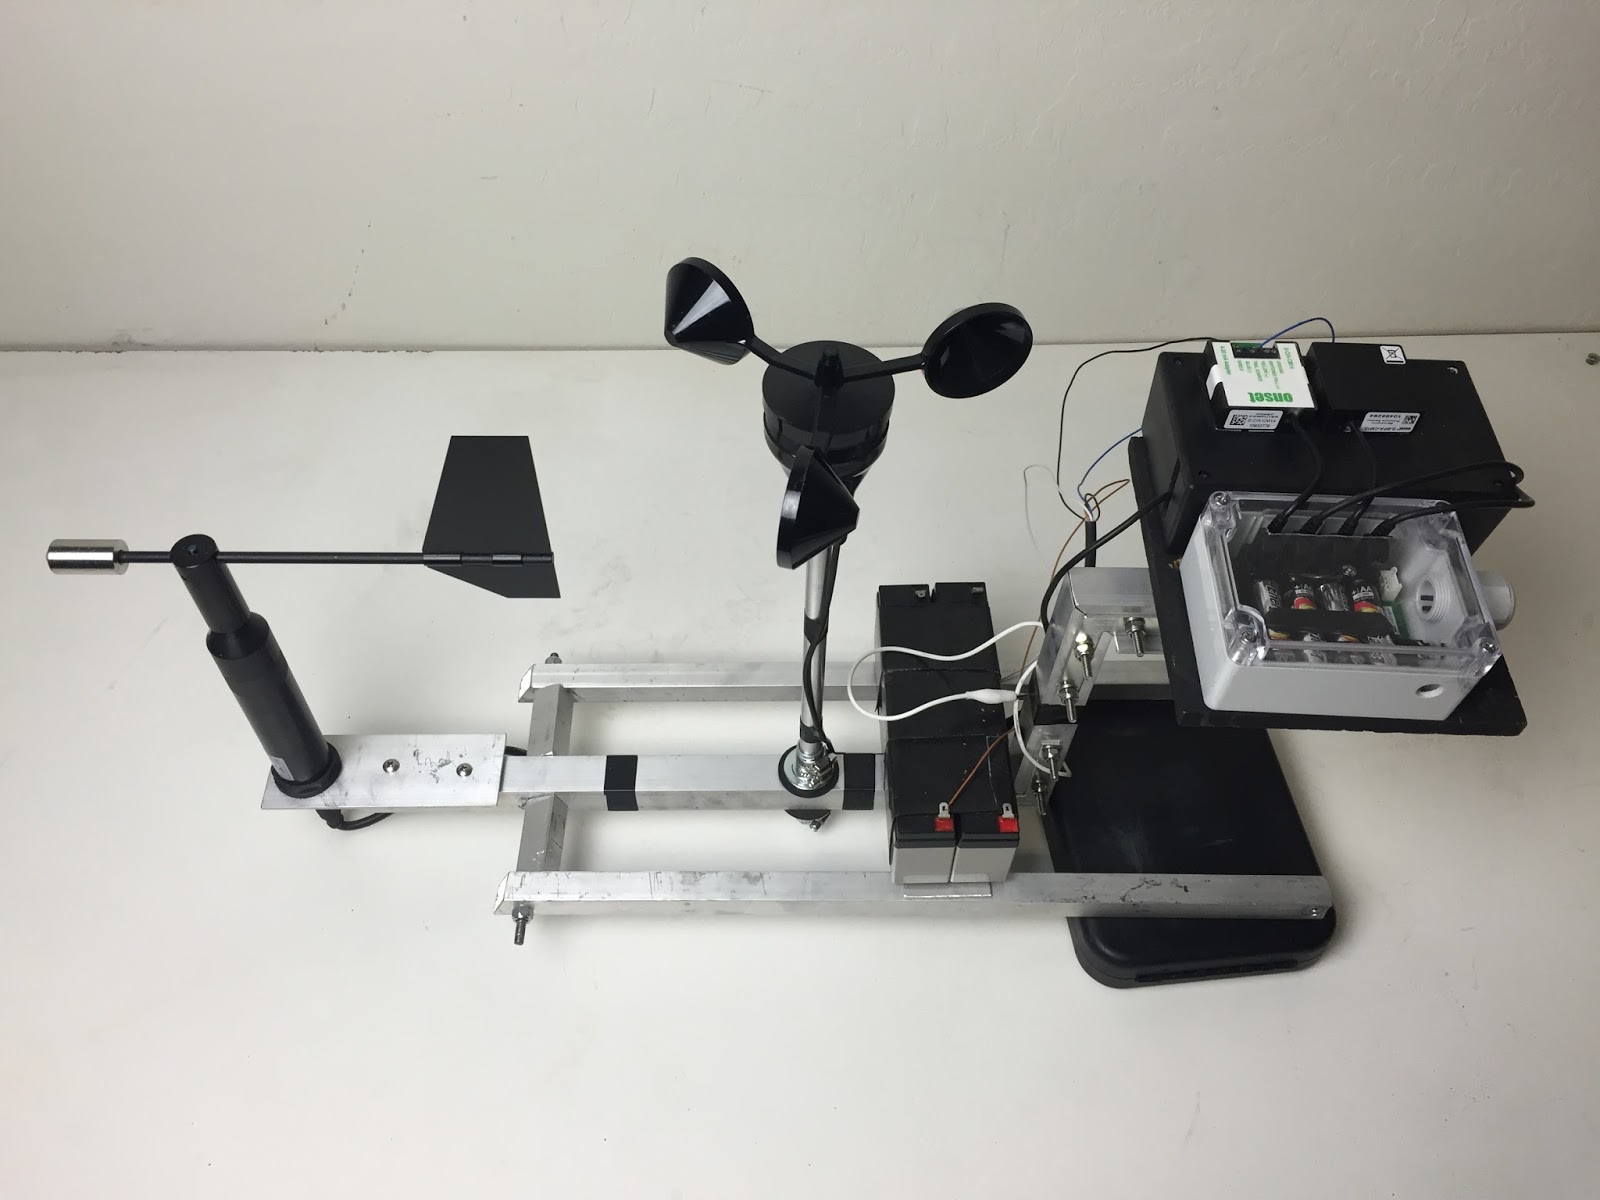 |
| Complete Data Logger Before it was Mounted to a Bike |
Adding the Bike
After assembling the data logger and sensors, we needed to connect it to a bicycle. We chose to mount the unit at the front of the bicycle because we wanted it to be the first thing in contact with the air. We didn’t want any interference with the rider’s body or parts of the bicycle.
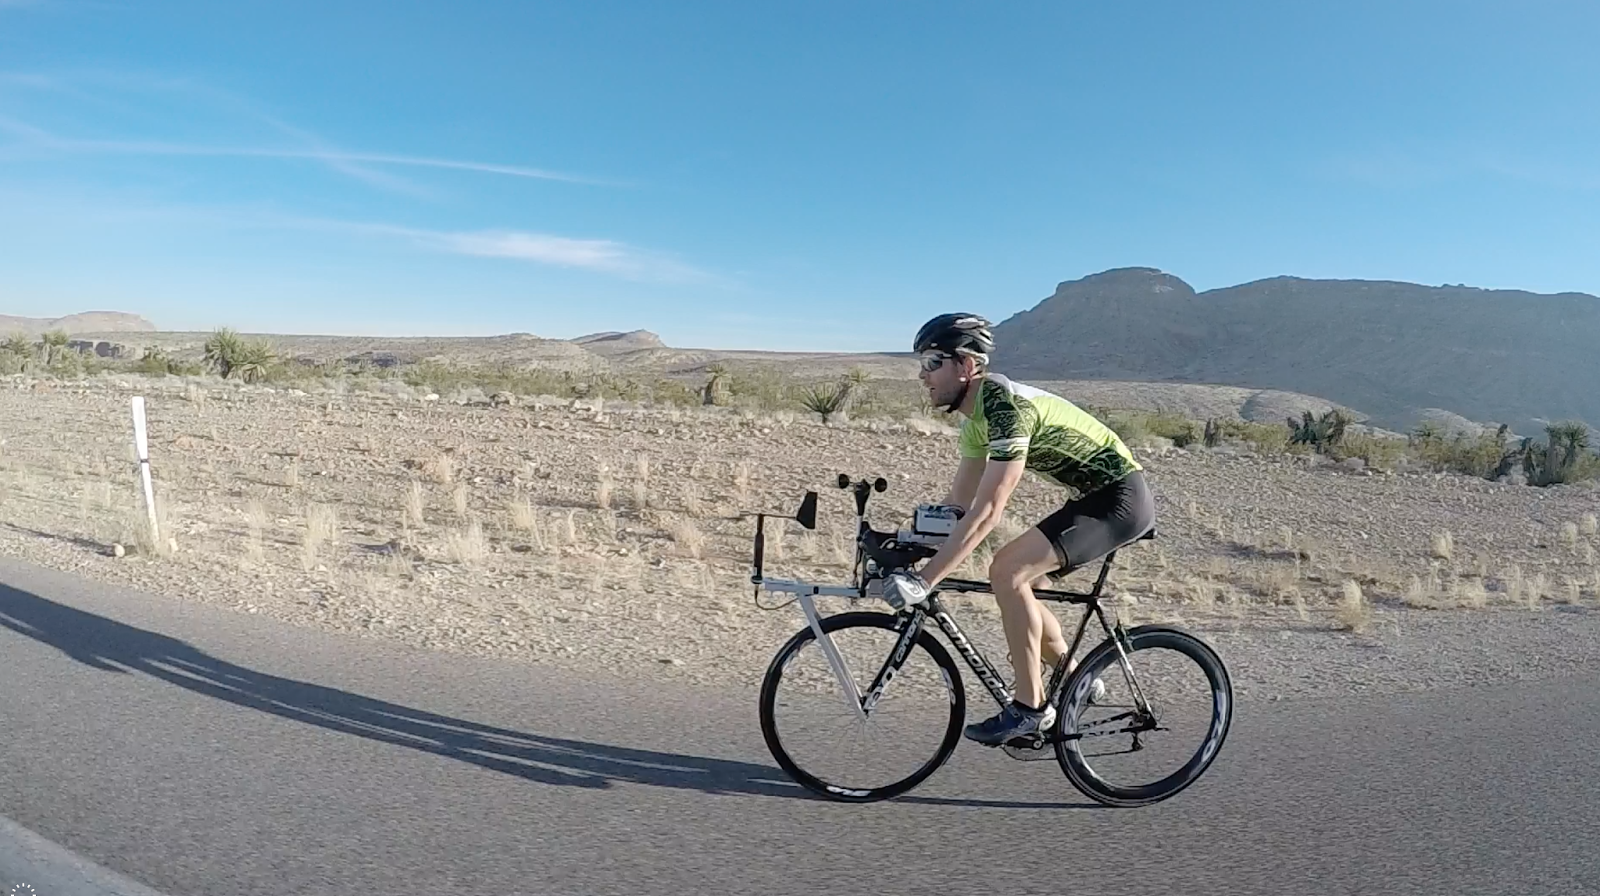 |
| Riding with the Data Logger Mounted to the Bike |
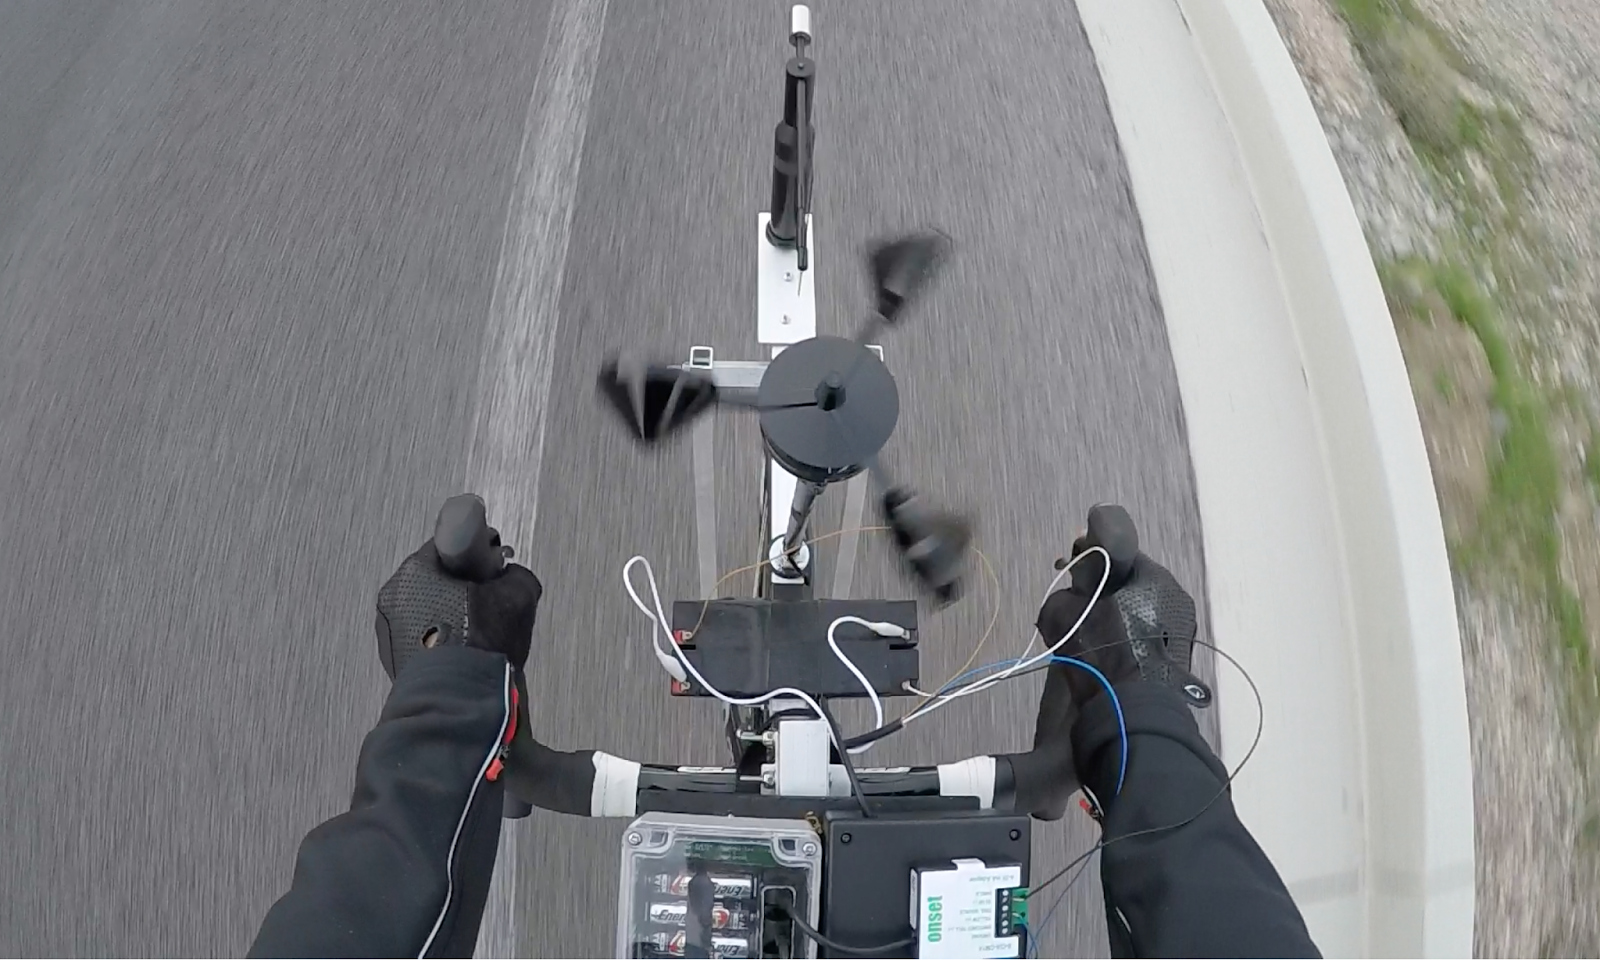 |
| Ride View of Data Logger |
Our data logger records a yaw angle and relative velocity measurement every second it is on the road. Here is a picture of the unit in action.
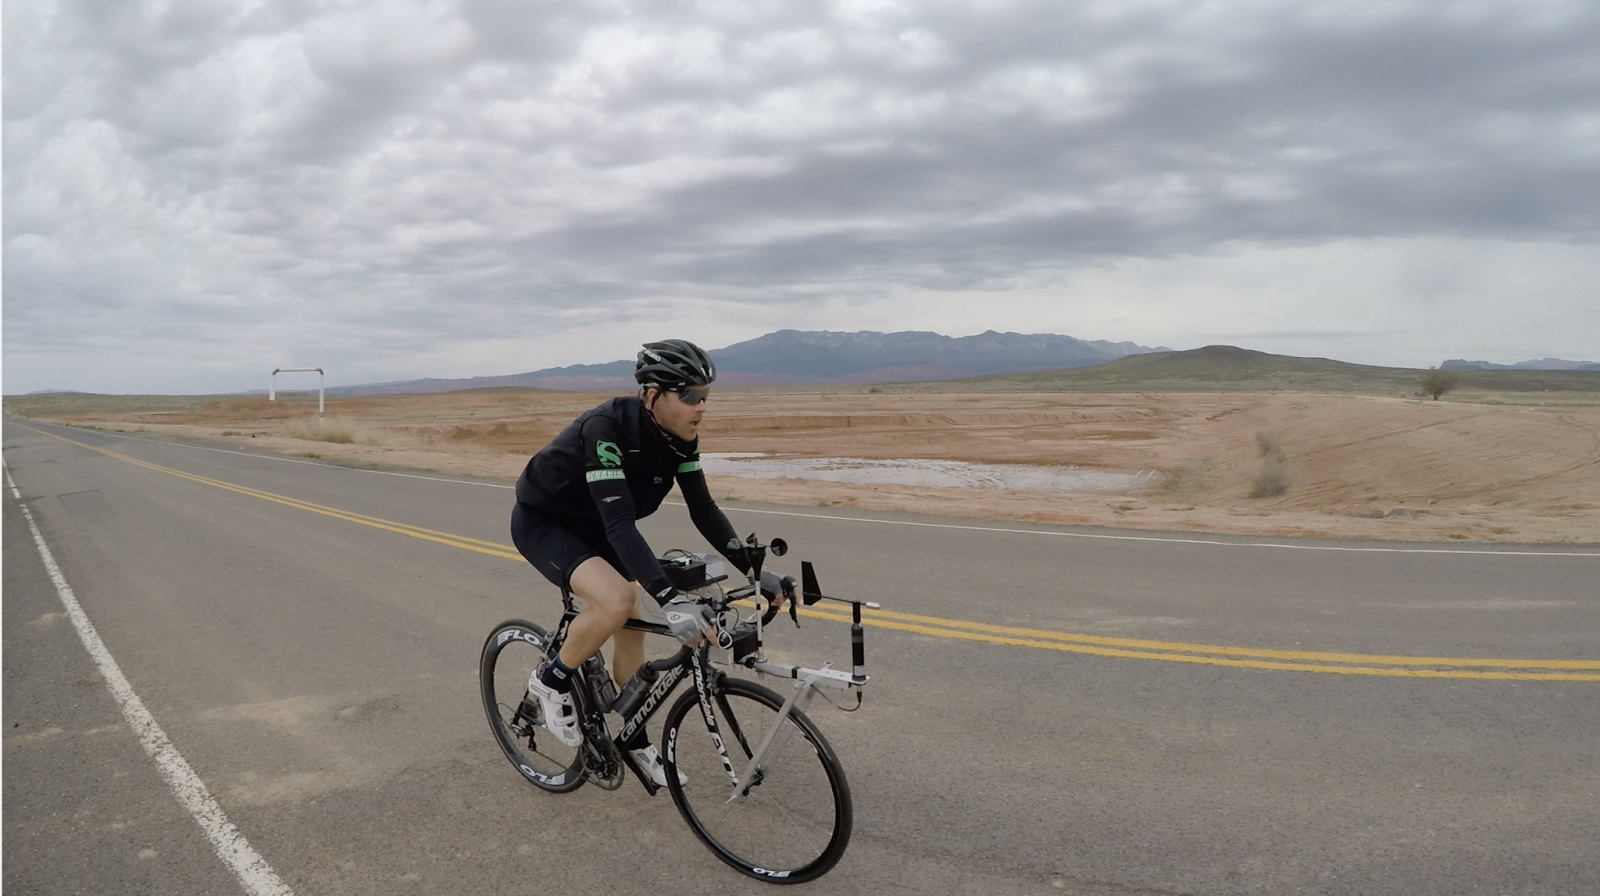
What Data did we Collect?
We chose to ride our data logger on a variety of Ironman race courses, and in a large variety of riding scenarios. We also mounted a GoPro to the bike that allowed us to sync the numbers with what was happening at the time of any event. Here’s a list of each.
Ironman Courses
Ironman 70.3 Silverman
Ironman 70.3 St. George
Ironman 70.3 Oceanside
Ironman World Championships in Kona (partial course).
Riding Scenarios
Descending
Climbing
Coastal riding
Wooded areas
Drafting
Sprinting
 |
| Collecting Data on the Ironman 70.3 St. George Course |
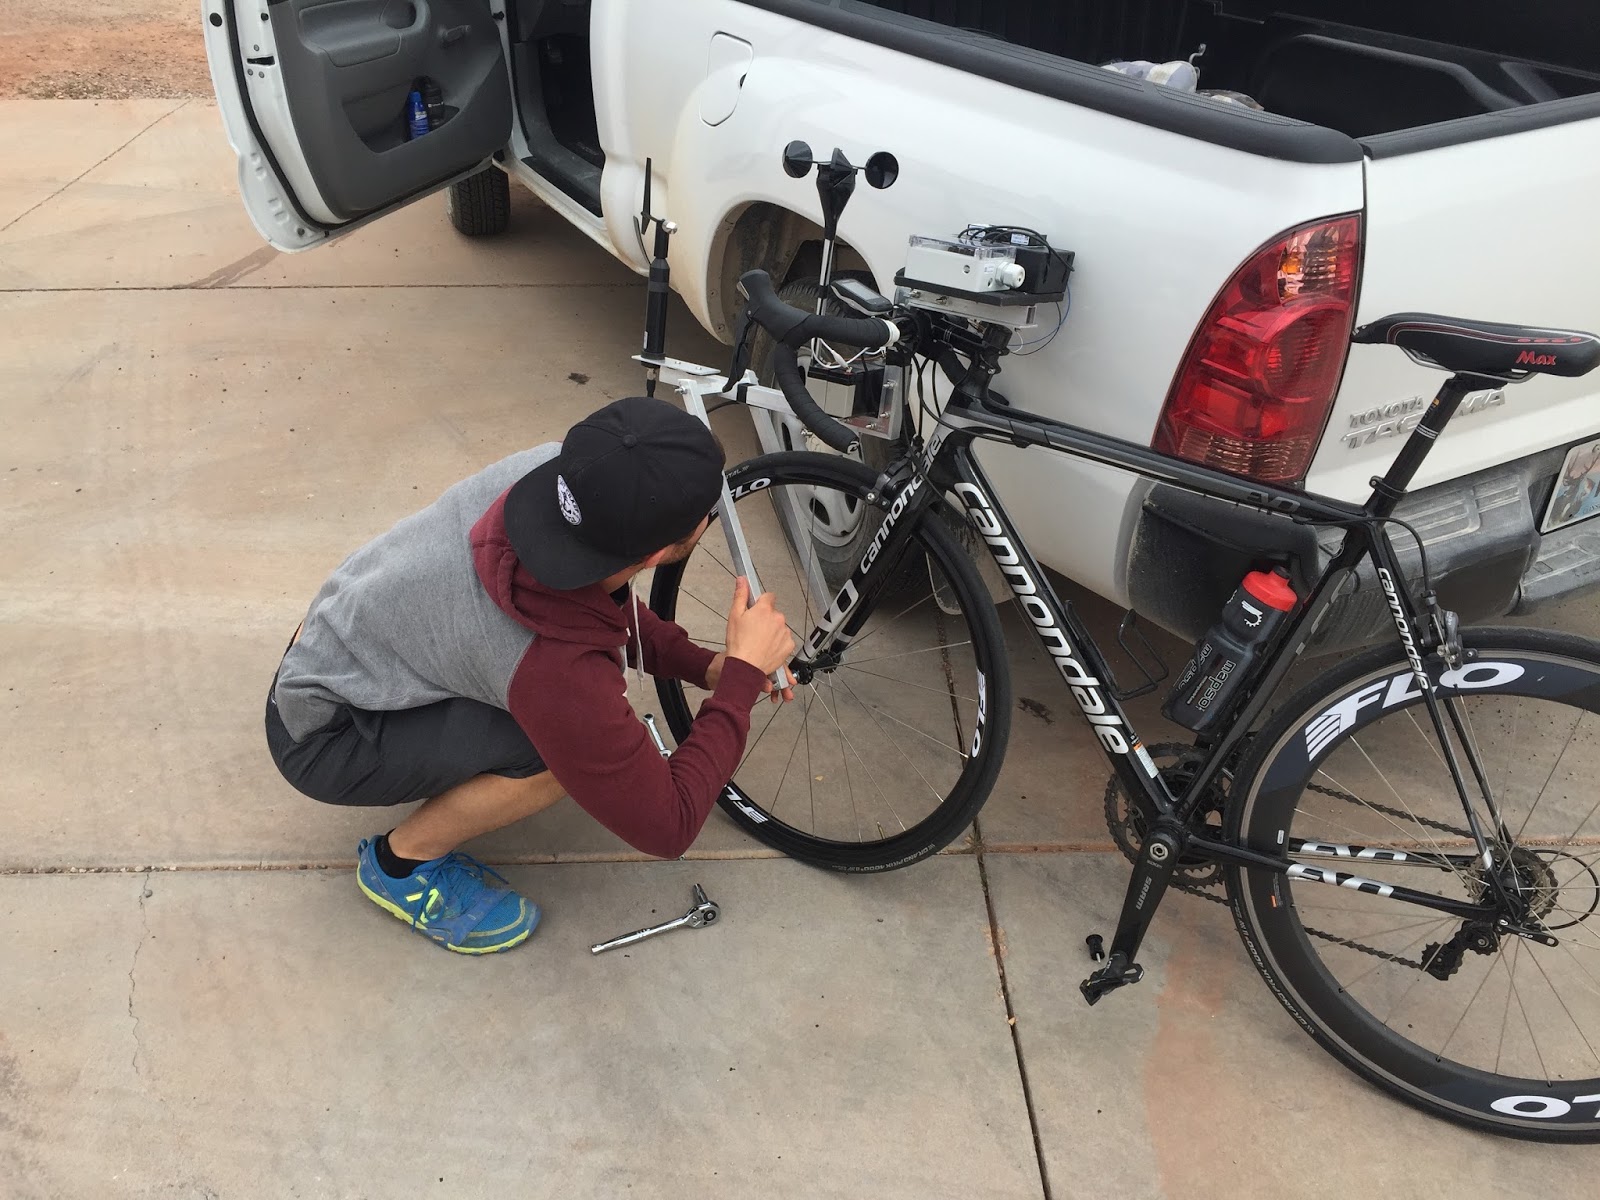 |
| Changing a Flat on the Ironman 70.3 St. George Course |
The Total Amount of Data Collected
In total we collected 55,000 readings or 110,000 measurements. Before this data could become useful, we knew we needed to analyze the data to look for patterns that would help us design better cycling wheels. For our analysis and the next step in our wheel-building process, check out Step 2 of this series, titled Data Analysis.
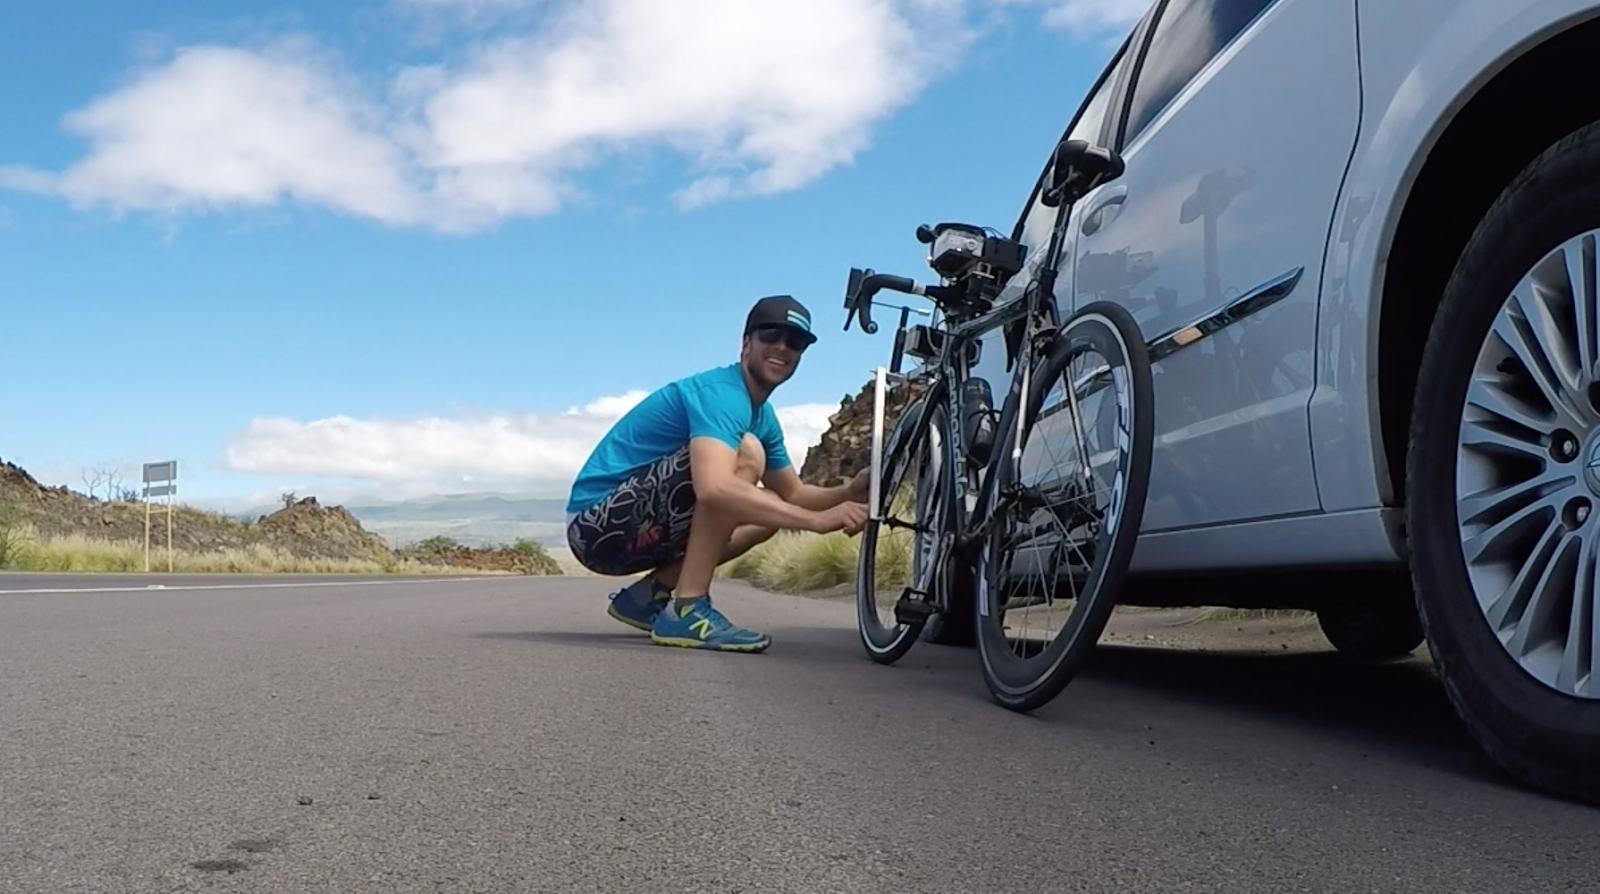 |
| Making Adjustments in Kona |
Co-founder at FLO Cycling. Jon manages the day to day operations and acts as the lead engineer for all FLO products.