
Note: For an updated version of this blog article displaying the time savings for our new 2016 model wheels, read this article.
There’s a list of common questions we see from people trying to understand the importance of cycling wheel aerodynamics. These questions include the following:
There’s a list of common questions we see from people trying to understand the importance of cycling wheel aerodynamics. These questions include the following:
1. Your CFD simulations and wind tunnel tests used wind speeds of 30mph. If I don’t ride at 30mph, do aerodynamic race wheels make sense for me?
2. How much faster will I go with race wheels compared to my stock wheels?
3. How much of a power saving will I see if I buy aerodynamic cycling wheels?
These are all great questions and are most commonly answered with rules of thumb. These include the following:
1. If you are travelling 30mph, you will save 40 seconds over a 40k if you reduce the drag by 100 grams.
2. 50 grams of drag reduction equates to 6.5 watts of power savings.
These numbers are true, but it does not help someone understand why or how these numbers relate to their specific case. This article will walk through all of the equations and show how and why these numbers are true. I have also made tables that show how drag reduction affects you at your speeds. It’s counter intuitive, but the slower you are, the more time you will save by upgrading wheels and reducing your drag. There is quite a bit of math in this post but don’t fret. I’ll do my best to walk through each step.
Relative Velocity
Before we get into the math, there is an important concept you should understand. This is relative velocity. When calculating drag, your speed is not simply the speed at which you are travelling on your bike. Relative velocity is the combination of the speed at which you are travelling on your bike and the velocity of the wind. This combination of velocities are known as the relative velocity. If you are traveling 15mph into a 5mph head wind, your relative velocity would be 20mph. If you were travelling 15mph with a 5mph tail wind, your relative velocity would be 10mph. For a more detailed explanation on relative velocity, you will find this post helpful.
How Drag is Calculated and its Components
Drag is defined as the force on an object that resists its motion through a fluid. If you stand in waist deep water and try to run forward, the force you feel holding you back is drag. Air also has drag, just not as much as water.
Drag is calculated with the following formula:
 |
| Drag Equation |
The variables of the equations are defined as follows:
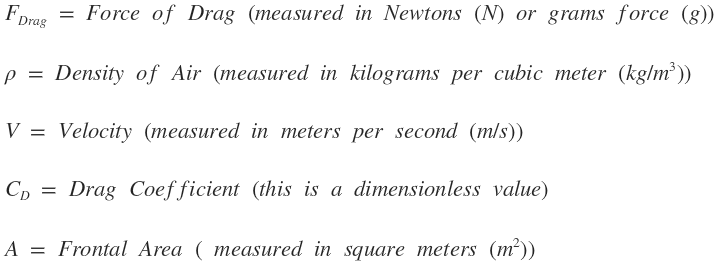 |
| Variables of the Drag Equation |
Most of the variables are self explanatory but there are two I will describe in more detail.
Drag Coefficient
Drag coefficients are associated with shapes. The lower the drag coefficient, the more aerodynamic the item is. The drag coefficient is determined in wind tunnel tests. Here is a list of common shapes and their associated drag coefficients.
 |
| Drag Coefficients for Common Shapes |
Drag coefficients are not limited to simple shapes. You can calculate a drag coefficient for any object. The following shows the drag values associated with human powered vehicles. For the rest of this post we will be using the “Racing (Fully Crouched)” data. This has a CD of 0.88 and frontal area of 3.9ft^2.
 |
| Drag Coefficients for Human-Powered Vehicles |
Frontal Area
Frontal area is commonly described as the area that sees the wind. As an example, imagine standing in a strong wind. If you were facing the wind, it would come in contact with the front half of you body. The back half of your body and your sides would not be in direct contact with the wind. In this situation, the front half of your body would be the frontal area. If you were to turn 90 degrees to the right, your left side would now feel the wind and would become the area in direct contact with the wind. This would be the new frontal area.
All objects have a frontal area, and for this post we will be using the value in the table above of 3.9ft^2 or 0.362m^2.
If you are Traveling at 30mph, you Will Save 40 Seconds Over a 40k by Reducing the Drag by 100g
To prove this is true let’s calculate the drag experienced by a cyclist using the CD and frontal area in the table above. Let’s first show the numbers used for the equation. (Note the tags like D Original are used to identify different values. As we move on we will use multiple CD values and this is a way to identify them.)

Using these values we can calculate the drag experienced by a cyclist in the “Racing (Fully Crouched)” position.

This says that a cyclist will experience an average of 3,580.423 grams of drag when riding at a relative velocity of 30mph.
Now let’s reduce the drag value by 100g and see what we get.

Now that we have calculated the new drag value, we can rearrange the drag equation to calculate the new CD value. It should be pointed out that in order to reduce the drag we have to lower the CD value.

Using the new equation we can calculate the new CD value when the drag is reduce by 100g.

With the new CD value we can now calculate the new speed seen by the cyclist by again rearranging the drag equation. In this example we are using the original drag force and the new CD value to calculate the new velocity. (Note: It should be pointed out that when velocity increases the drag also increases. This means the calculation is not perfect but it does provide a very close estimate. To know the exact number you would need to study the configuration in a wind tunnel).

Now we can calculate the new velocity. Let’s see what we get.

Now that we have the new velocity we can determine the time savings over a 40km race.

From this we can see that the industry standard stating that you will save 40 seconds over a 40km when traveling 30mph is true. There is a difference of 1.95 seconds but this difference could easily be explained by using a different frontal area, different CD values or taking the affect the increased velocity had on the drag value into consideration.
How Much Faster Will I Go at the Speed I am Traveling?
As stated above, it’s counter intuitive but you actually save more time the slower you travel. The cool thing about the calculations above is that you can easily calculate the new speeds and time savings for any original speed you like. A CD value is a CD value no matter what speed you are traveling and remains constant for all of the calculations. I have put together a table that shows the time savings and new speeds for each original speed from 1mph to 30mph when you use the new CD value. The values for a 40km and an Ironman in seconds are listed below.
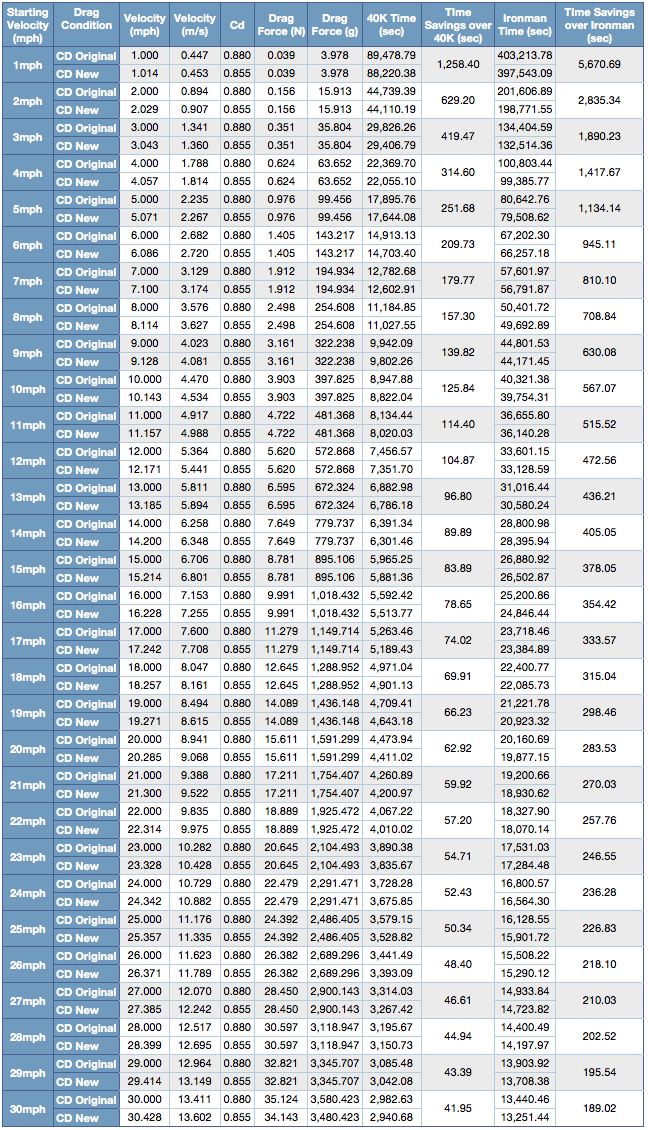 |
| Time Savings at Any Speed when Removing 100g of Drag at 30mph |
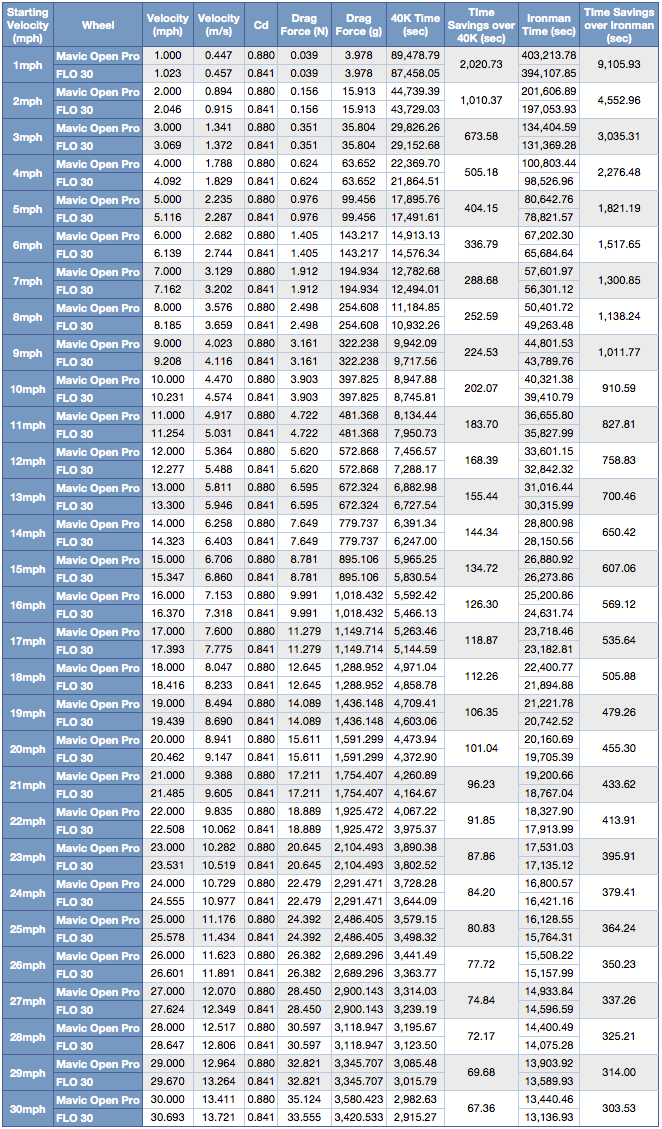
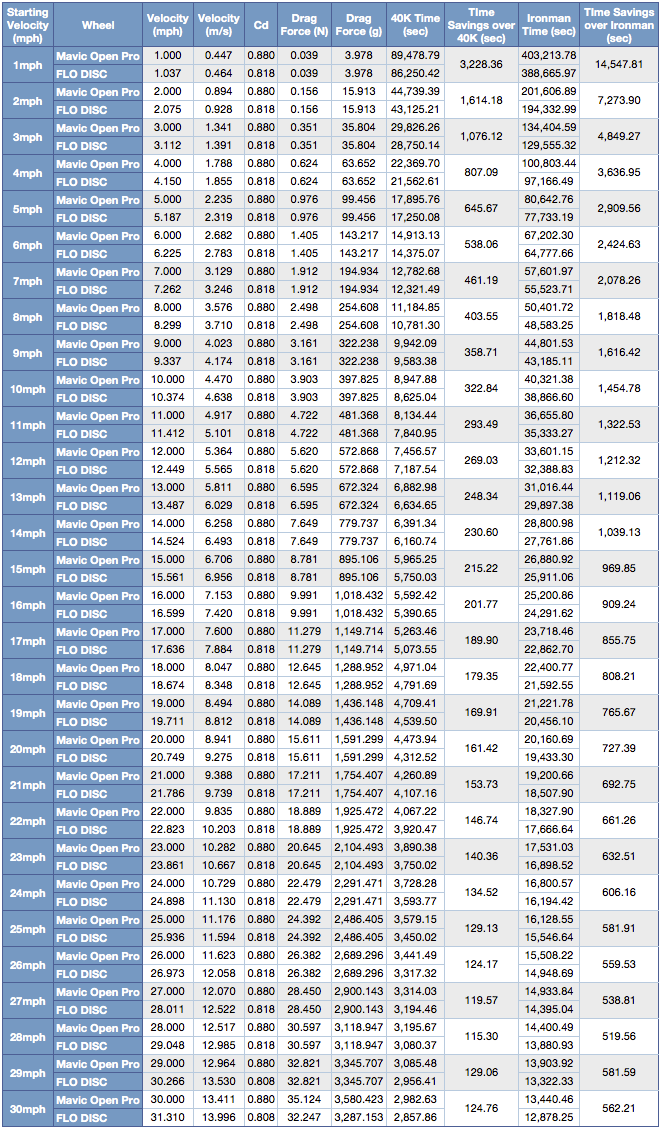
The next best question is how much time will I save with a FLO 30, FLO 60, FLO 90, and FLO DISC. The following shows the savings for each wheel. Remember if you have two wheels multiply the savings by two.
FLO 30 Time Savings at Any Speed
FLO 60 Time Savings at Any Speed

FLO 90 Time Savings at Any Speed

FLO DISC Time Savings at Any Speed
Proving 50 grams of Drag Reduction Provides 6.5 watts of Power Savings at 30mph
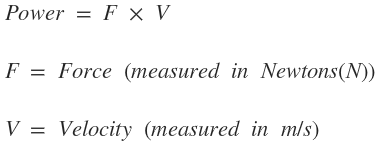
This one is an easy one compared to the last one. Let’s look at the equation for power.
Using the equation for power we find the following.
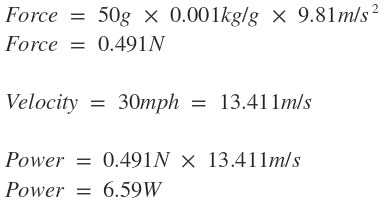
This proves that the standard is true and shows you how to calculate the value.
Here is how much power the FLO Wheels can save you at a relative velocity of 30mph.
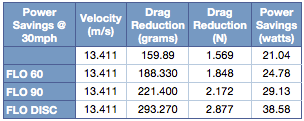 |
| Power Savings at 30mph |
Summary
I hope that you’ve found this article helpful and that you didn’t get lost along the way. There is a lot to take in, but it should help you to better understand the importance of aerodynamics and how they affect you and your time on the bike.
For more great content, please register for our free monthly newsletter at the top of the column on the right. We send links to all the articles we post during the month. Please ask questions and post your thoughts below.

Co-founder at FLO Cycling. Jon manages the day to day operations and acts as the lead engineer for all FLO products.