If you read Part 7 last week, you will remember that at the end of the post, I said we were headed back to the drawing board. Our CdA numbers were not what we expected and I was a bit frustrated. However, I received an email from one of our past customers, who is currently studying aeronautical engineering in the Netherlands. Ironically, he was in town this week preparing to challenge the World Record for the Human-Powered Speed Challenge at Battle Mountain, NV. He had some thoughts about our results after spending a lot of hours in wind tunnels and testing on the road with the design team. We sat down over lunch to discuss them.
Comparing Apples to Apples
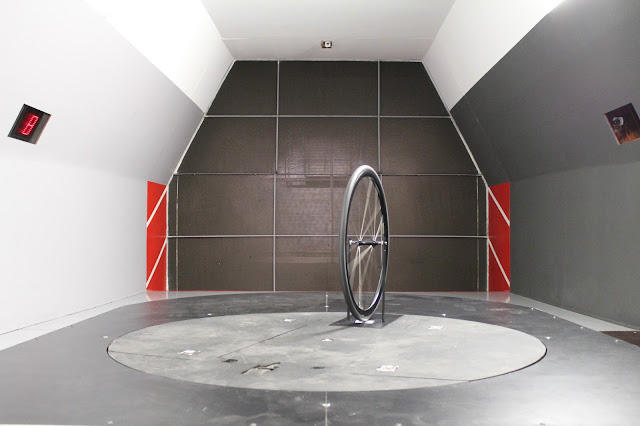
My first error was looking at old wind tunnel data and I should have known better. CdA numbers for cyclists that are collected in a wind tunnel are much different than what you would find on the road. A wind tunnel has nearly laminar flow, while on the road the air is likely turbulent. If it is turbulent that changes things in a big way. Thinking about this alone we start to see why the numbers are higher than what is recorded in a wind tunnel.
Another component to consider is that on the road, the ground does not move with respect to the contact patch of the tire. In the wind tunnel there is a fixed ground plane and the wheel spins on a rotating wheel. To add to this, the wind tunnel assumes that the relative velocity matches the rotational speed of the wheel and on the road this can be much different. These factors also help account for the higher CdA results we calculated.
The general theme of the email I received was that to be fair, I should be comparing wind tunnel results to wind tunnel results and road test results to road test results. Comparing wind tunnel results to road test results really doesn’t make much sense, unless you want to pull your hair out.
More Talking
I have another good friend who has spent a lot of time with an Aerostick. The Aerostick was developed by Andy Froncioni at Alphamantis. It’s a wind angle and relative wind speed sensor that mounts to the bike. Andy has done great work in this field and the Aerostick is the real deal.
After spending time with the Aerostick, my friend found similar results to ours. Not only is the road a completely different environment when looking at the airflow, there are also a number of differences when looking at the bike and rider.
Consider the following. When a bike and rider enter a wind tunnel, the bike is mounted to a fixed point similar to a trainer. The rider then does their best to pedal while staying as still as possible. Since the bike is fixed, there is little rotation of the handler bar and little if any rocking of the bicycle from side to side. When you are on the road, the bike moves a lot. If you were to mount a camera to the down tube that focused on the front wheel, you would see that it rotates a few degrees with each pedal stroke. You also rock the bike when pedaling. These are just a few things that make road testing much different than wind tunnel testing.
Now What?
First, I agree with everything I’ve written above. Does it make it true? I’m not sure. The only way to find out is to do more testing. Here are the next steps.
1. Since we see a number of differences at individual yaw angles we need more time to measure averages. Our initial tests told us that on average, a more aero position had a lower CdA. To get a better average we will use a longer test run.
2. We have to test a number of tires on road and compare the results and then take those same tires to the wind tunnel.
3. We should be able to rank each tire from lowest CdA to highest CdA in both the wind tunnel and road test. Then we can compare those results. In theory they should be the same or similar.
It’s time to get back to work.

Co-founder at FLO Cycling. Jon manages the day to day operations and acts as the lead engineer for all FLO products.

