
It’s been a while since I’ve posted about our tire study. Things have been busy here at FLO.
Our last post discussed our maiden voyage. Since that time we’ve spent a lot of time riding the sensor around and have started to analyze the results. While we are not 100% of the way there, we are finding some cool things. Let’s recap what we’ve been up to.
What is CdA?
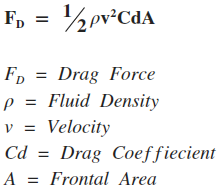
Before we go any further what is CdA. CdA is the drag coefficient multiplied by the frontal area. The drag coefficient is a dimensionless value for a shape. For example a sphere has a Cd of 0.47 and a streamline body – like an airplane wing – has a value of 0.04. The lower the Cd value, the lower the drag force produced. If you look at the equation below you can see why this is true.
Frontal area is the projected area of a body. If you were to take a life size picture of a person riding a bike straight towards you, you could measure the area of the bike and rider. This area is the frontal area. This picture from Faster shows the frontal area of the different triathlon disciplines.

The Chung Method
If you do any reading about CdA testing on the road you are bound to hear about the Chung Method. Robert Chung has done great work in the field and if you are interested I suggest you check out his work. The method allows you to estimate your CdA by solving for slope. While I won’t get into all of the details here, it’s been proven to be pretty accurate. In the Chung Method, Robert discusses how using watts we can solve for CdA. In order to start we have to break down the forces of the bike and rider.
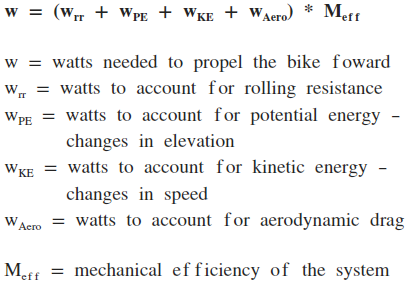
The above equation shows that the watts recorded from our power meter equal the watts of the entire system. Moving forward, for simplicity, we are assuming mechanical efficiency is 100%. If we break each watt component down further we get the following.
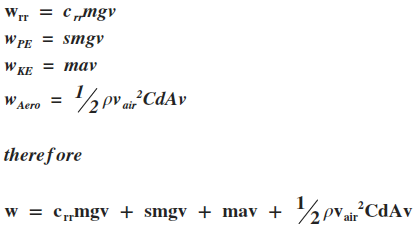
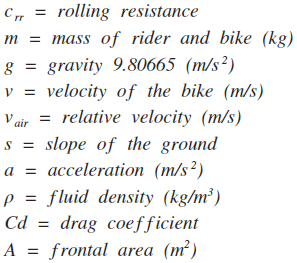
Each of the units above are specified below.
To solve for CdA all we have to do is rearrange the formula. When we do, we get the following.
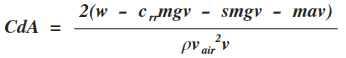
The Chung Method assumes you are not able to measure relative velocity and yaw angle. Since it makes this assumption, the CdA value that is calculated does not take these values into consideration. With our sensor we are able to measure relative velocity and yaw angle. In our calculations we calculate a CdA value for each second of the ride, and also record the yaw angle that generated the value.
Our Results – What We are Finding So Far
If we look at the average of one ride vs another we are able to see differences in CdA values. For example. We rode the same course in a tucked aero position and in an upright position. The CdA for the aero position was lower.
CdA Aero Postion = 0.76
CdA Upright Position = 1.04

Problems
The first issue that stands out is that the CdA values are higher than what you would find in a wind tunnel. We are looking into why.
The second issue we are seeing is that for the same yaw angle we are getting different CdA values. In theory, if the rider stays still then the CdA for the same yaw angle should be the same. So why isn’t it?
Our best guess right now is that it is a combination of a few things.
1. The data logger and our Garmin are not synced on the same time clock. Therefore a reading from the Garmin could be half a second off from the reading on the data logger.
2. The Garmin does not record slope. We are using slope values from Google Earth. These values may not be accurate.
3. Garmin connect provides export data every 0.167 minutes. We are using RaceDay software to export the Garmin file data to .csv file. The export displays readings every second. I am not sure if these are taken directly from the Garmin file or if RaceDay is doing work behind the scenes.
4. The accuracy of the Garmin and our data logger may be catching up to us.
Where To Next
The next thing we have to do is get more time on the road. We also have to answer some of the questions listed above. In reality, the average CdA from our sensor measurements for a ride, may be accurate when compared to the CdA results collected at a wind tunnel. We’ll have to find out.
In a perfect world, we would be able to sync all of the measurements to the same data logger. I guess it’s back to the drawing board for now.

Co-founder at FLO Cycling. Jon manages the day to day operations and acts as the lead engineer for all FLO products.