
For a while now, I’ve wanted to study the aerodynamic performance of tires on the road. We’ve done a bit of work in a wind tunnel, which is great, but it’s not the real world. In order to get the job done, we needed a way to log data on the road. Quite some time ago I started developing a logger on my own by programming a microcontroller and building sensors. While I got pretty far, there were a number of things that weren’t where they needed to be. The biggest concern was accuracy. The picture below is of the logger I built.
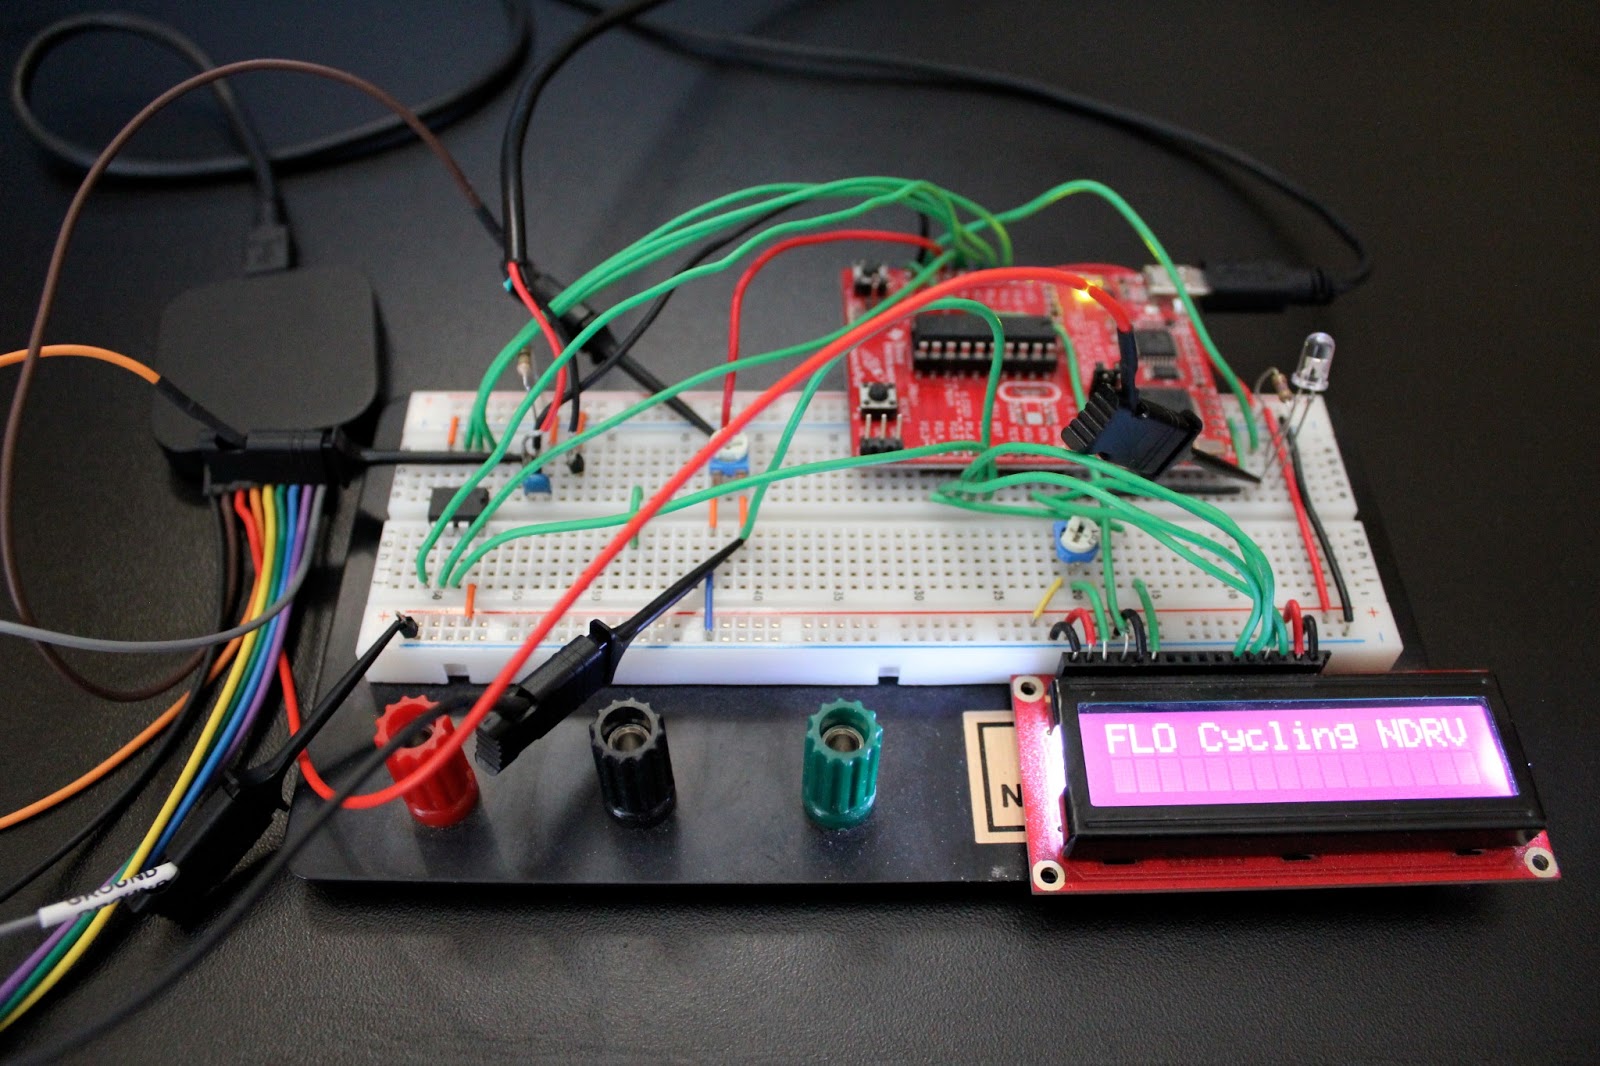 |
| Microcontroller that I developed to read yaw angles, rider speed, and wind speed. |
Once I realized accuracy would be a problem, I put things on the back burner for a while. Last year during Interbike I sat down with Ryan Cooper from Best Bike Split and we talked about his work with the Trek Factory Racing Team. He mentioned that math models were now able to predict accurate yaw angles of the riders, rider speed, elevation, and a number of other things. We also discussed the logger I had been developing and Ryan mentioned he would be interested to check his results against the results I was able to measure on the road. That conversation got the ball rolling again and I went on a search for a logging system that would get me the accuracy I needed.
Weather Stations are Great Loggers
After doing quite a bit of research, I found that some of the best data loggers were weather stations. They have the ability to sit in remote locations (battery powered), can collect large amounts of data over time (onboard memory storage), and collect multiple data points (versatility). This all seemed like a good fit, but I just needed to figure out how to mount it on the front of a bike!
Onset’s Hobo Micro Station
Luckily I found a system that worked for me. I found a company called Onset that had a micro weather station that took four inputs and would mount well on my bike. I ordered the micro station and five sensors.
1. Temperature sensor (Altitude-related measurements)
2. Humidity sensor (Altitude-related measurements)
3. Barometric pressure sensor (Altitude-related measurements)
4. Wind direction sensor (Yaw angle measurements)
5. Wind speed sensor (Relative velocity measurements)
A few days ago, the micro station, temperature sensor and barometric pressure sensor arrived. The wind speed sensor, humidity sensor, and wind direction sensor (on special order from Germany) are still on the way, but I was able to test the parts I did have.
With an initial set up, I was able to test the micro station’s logging capability, the software package, and the sensors, I mounted the micro station in the back of my truck and went for a drive up to Lee Canyon outside of Las Vegas.
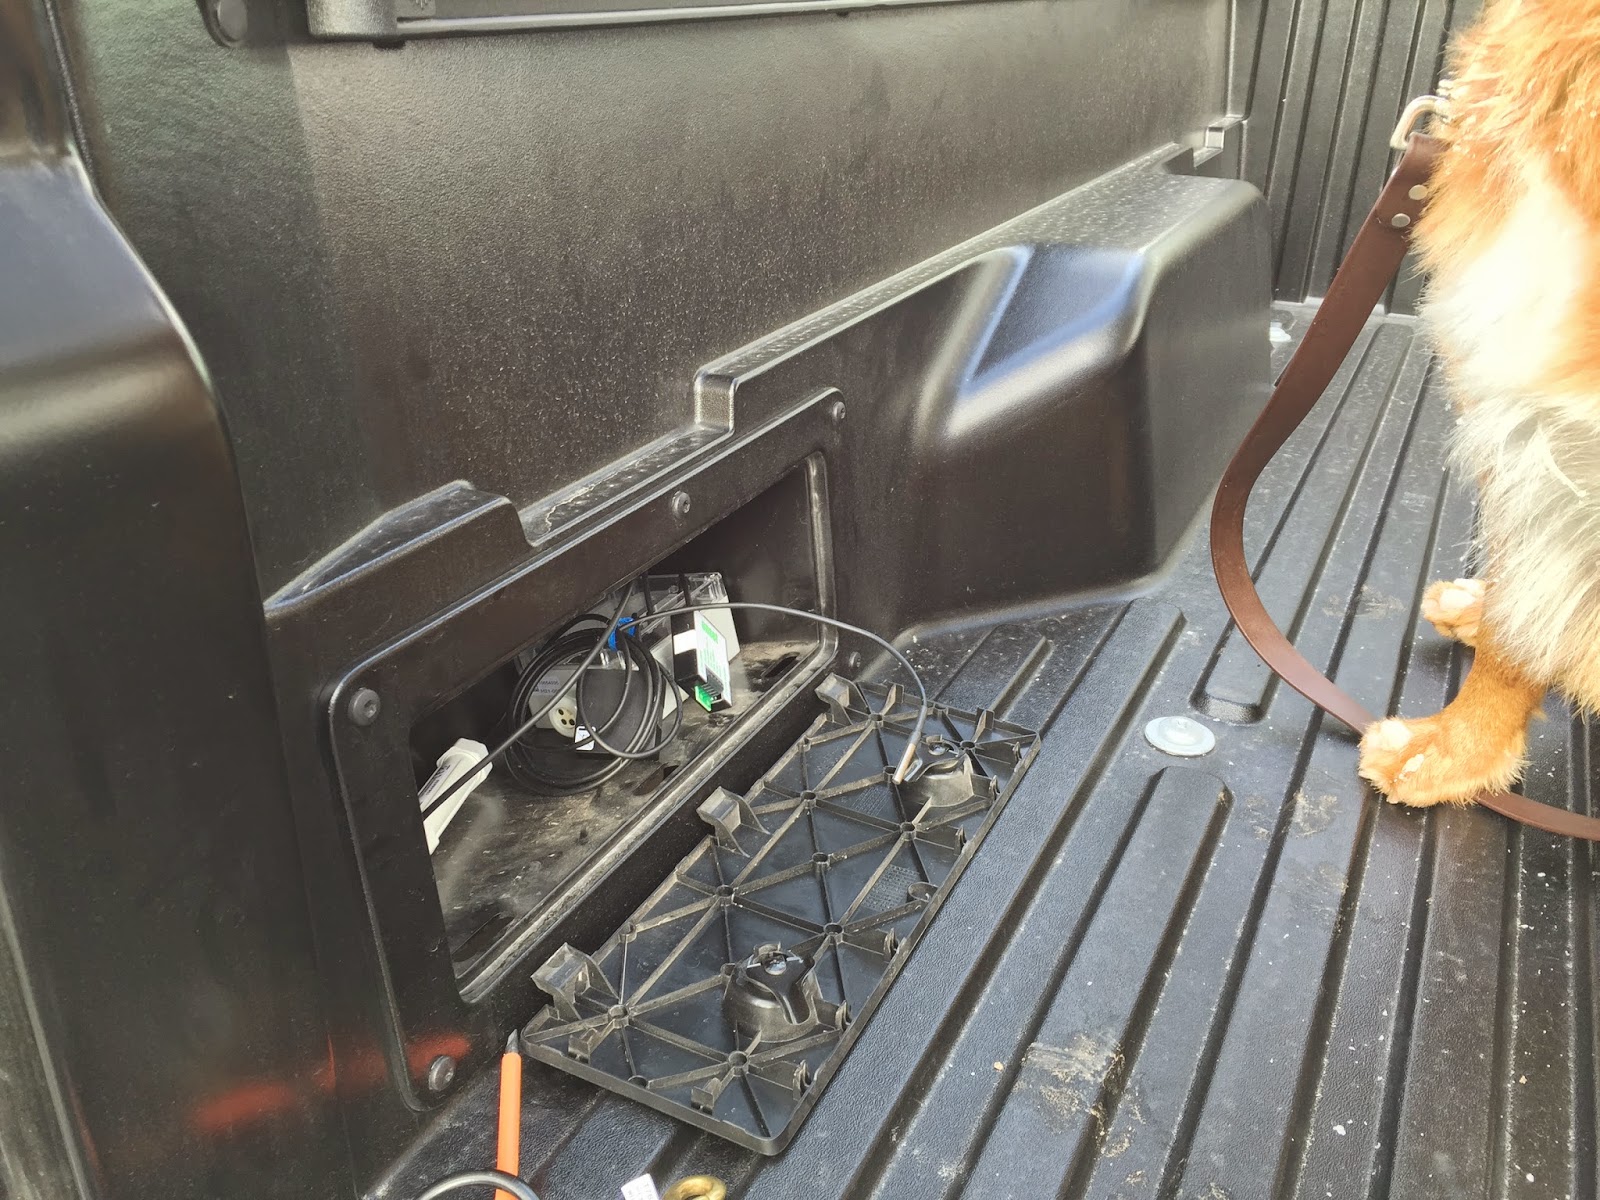 |
| Micro station mounted in my truck and a dog who was ready for a walk. |
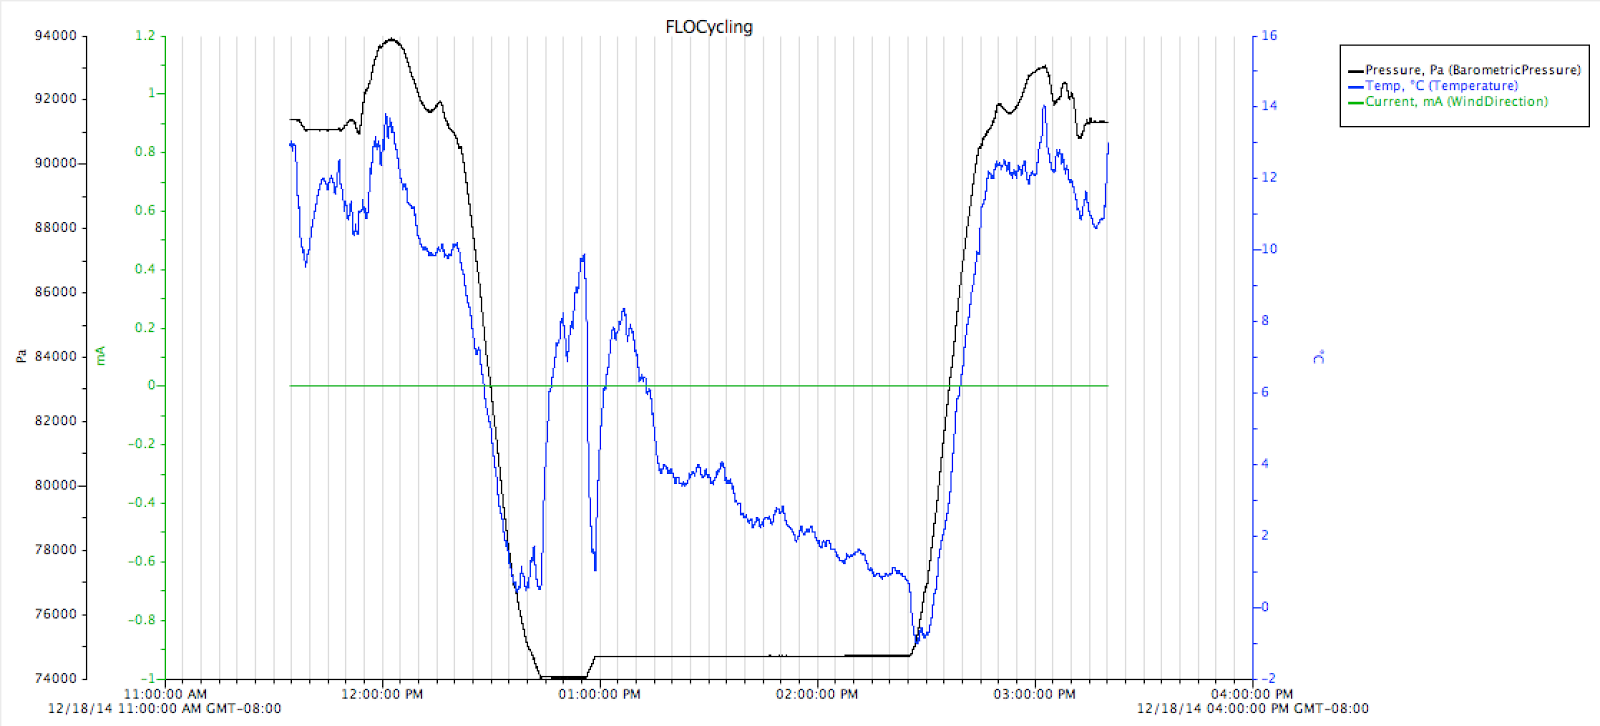
The micro station was recording temperature and barometric pressure every second for just under four hours. The flat line in barometric pressure displays a time when my truck was parked while I was walking my dog. Remember, as elevation increases, barometric pressure decreases. The black line in the graph below shows the barometric pressure. The blue line is the temperature. There are a few jumps which relate to the sensor being in and out of the sunlight.
Calculating Elevation
The reason I got the barometric pressure sensor was to get accurate elevation data. If you use the barometric formula – which there are a number of variations of – you can solve for altitude. The barometric formula I used was the one below. I believe I will have to modify this to incorporate temperature and humidity but that will be another day.
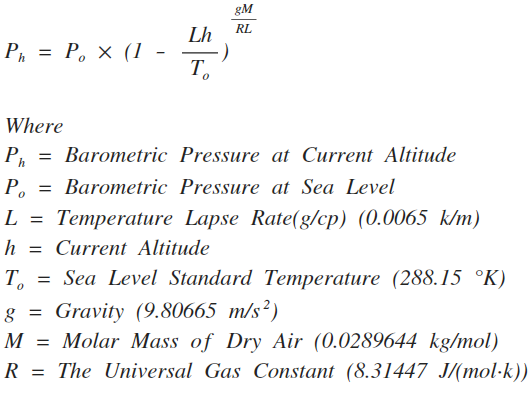
I needed to solve for height since I had the current barometric pressure so I rearranged the equation to the one below. I dusted off the math skills on this one. =]
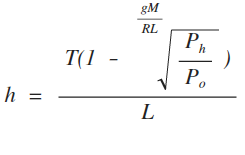
With the new formula, I was able to calculate the elevation for each barometric pressure I recorded. The results are graphed below. The hardest part was putting the above equation in a Excel! Here is what I found.
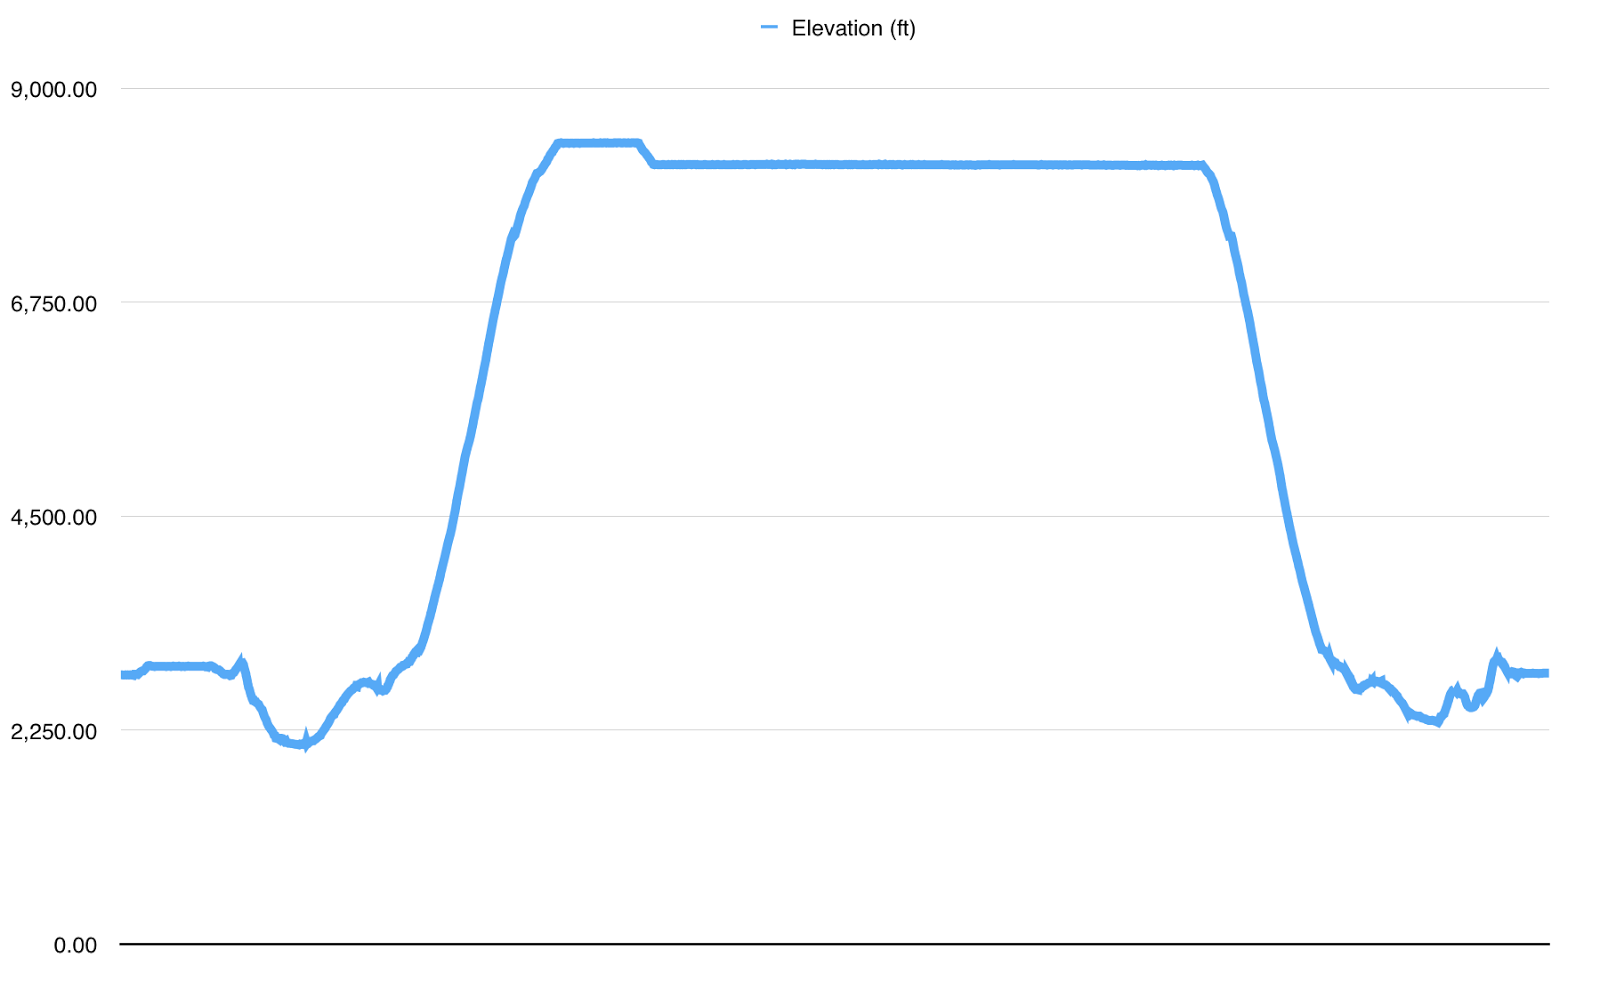
Results
To be honest I am pretty impressed with the data logger. For the most part, the elevations are spot-on, but the data did leave me with a few questions. For starters, I noticed that the elevations of my driveway – my starting and stopping point – were different. I am no meteorologist, but my guess is that there was a shift in the barometric pressure over the four hours I was gone, or that not including temperature and humidity values in the equation was the problem. Today I am logging data for 12 hours in my driveway to see if my theory on barometric pressure shift is correct.
That’s it for today. I will report back soon with the results of the 12-hour log in my driveway. Hopefully by then I’ll have a few more parts to test out.

Co-founder at FLO Cycling. Jon manages the day to day operations and acts as the lead engineer for all FLO products.