
Over the last few days, I’ve been able to get out on the road to test the sensors and my carpentry skills. Everything has been going really well. Here is a quick update on what we’ve been doing.

The Voyage
The first ride was at a slow-paced eight mile trip. I wanted to make sure things were working properly before I spent too much time on the road. I wasn’t using GPS or power for this ride. Below I’ve added a quick video clip of the ride.
The Results – Percentage of Time at Each Yaw Angle
The first thing I looked at was the percentage of time spent at each yaw angle. I started considering measurements at three mph. The data logger records measurements every second so I counted the number of measurements in for each yaw angle. Once I had the number of measurements, I could determine the percentage of time spent at that yaw angle. Finally I looked at cumulative amount of time in a yaw angle range. The bold section in the table below shows where the majority of the time was spent.

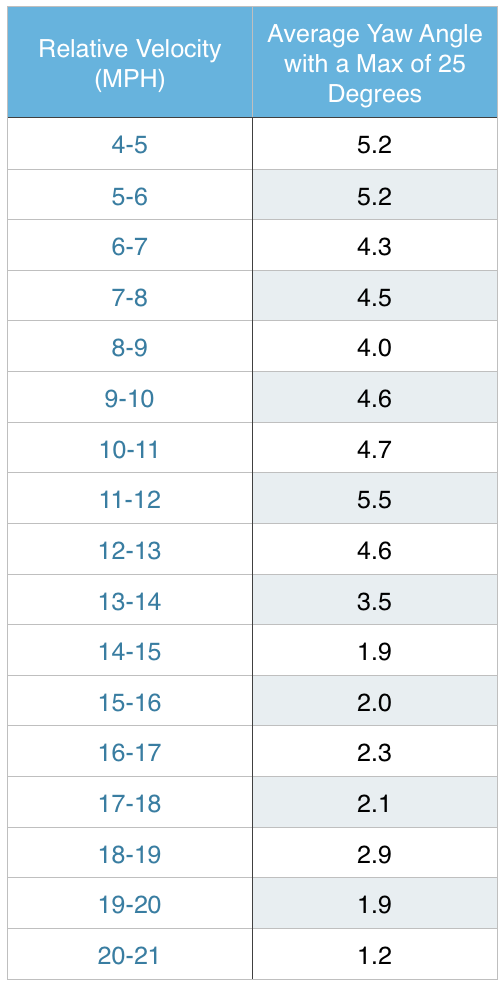
The Results – Average Yaw Angle at a Relative Velocity
The next thing I looked at was the average yaw angle for a specific relative velocity. I selected all of the yaw angle measurements taken at a specific relative velocity and averaged them. Here is what I found.
Thoughts
My first thought is that eight miles is not going to tell us a ton. My second thought is that it looks like the rider/air interaction is different than I thought. Old studies we’ve read have shown the average yaw angle is between 10-20 degrees of yaw. These results show something completely different.
We’ve already started gathering more data and are working on more specific tests to get ready for our tire study. Stay tuned for more updates.

Co-founder at FLO Cycling. Jon manages the day to day operations and acts as the lead engineer for all FLO products.