
I’ve learned a lot since I posted “Studying Tires Part 1, Logging Data.” I mentioned that I believed there was either a shift in the barometric pressure, or that the absence of temperature and humidity were the reason for the shift in my driveway’s elevation. Today I have the results.
A 12-Hour Backyard Plot
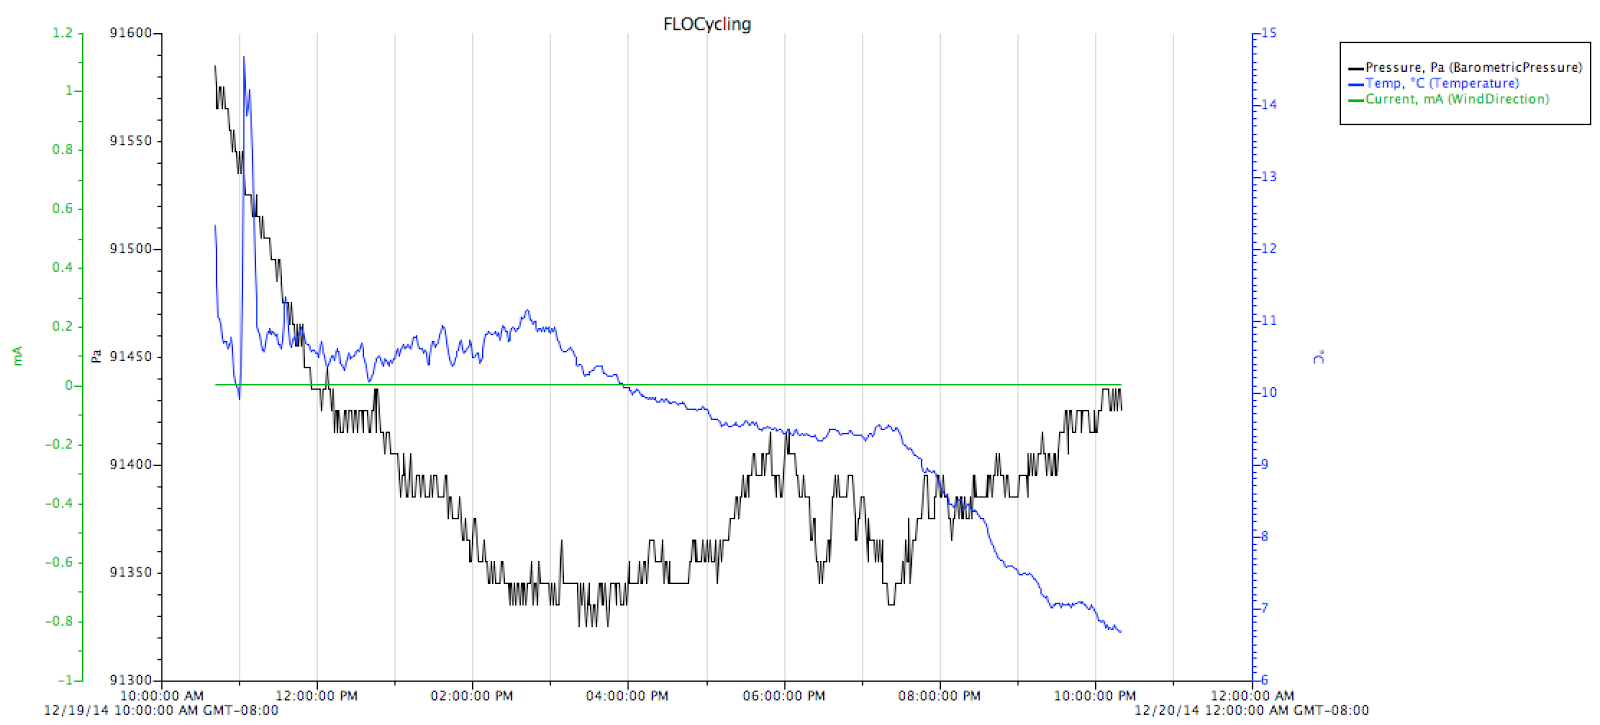
The graph below shows the barometric pressure over a 12-hour period. I placed the logger in my backyard out of the sun to try and minimize and temperature variation.
To make things easier to see, I calculated the elevation for each barometric pressure reading. The graph below shows the elevation of my backyard over the 12-hour period.
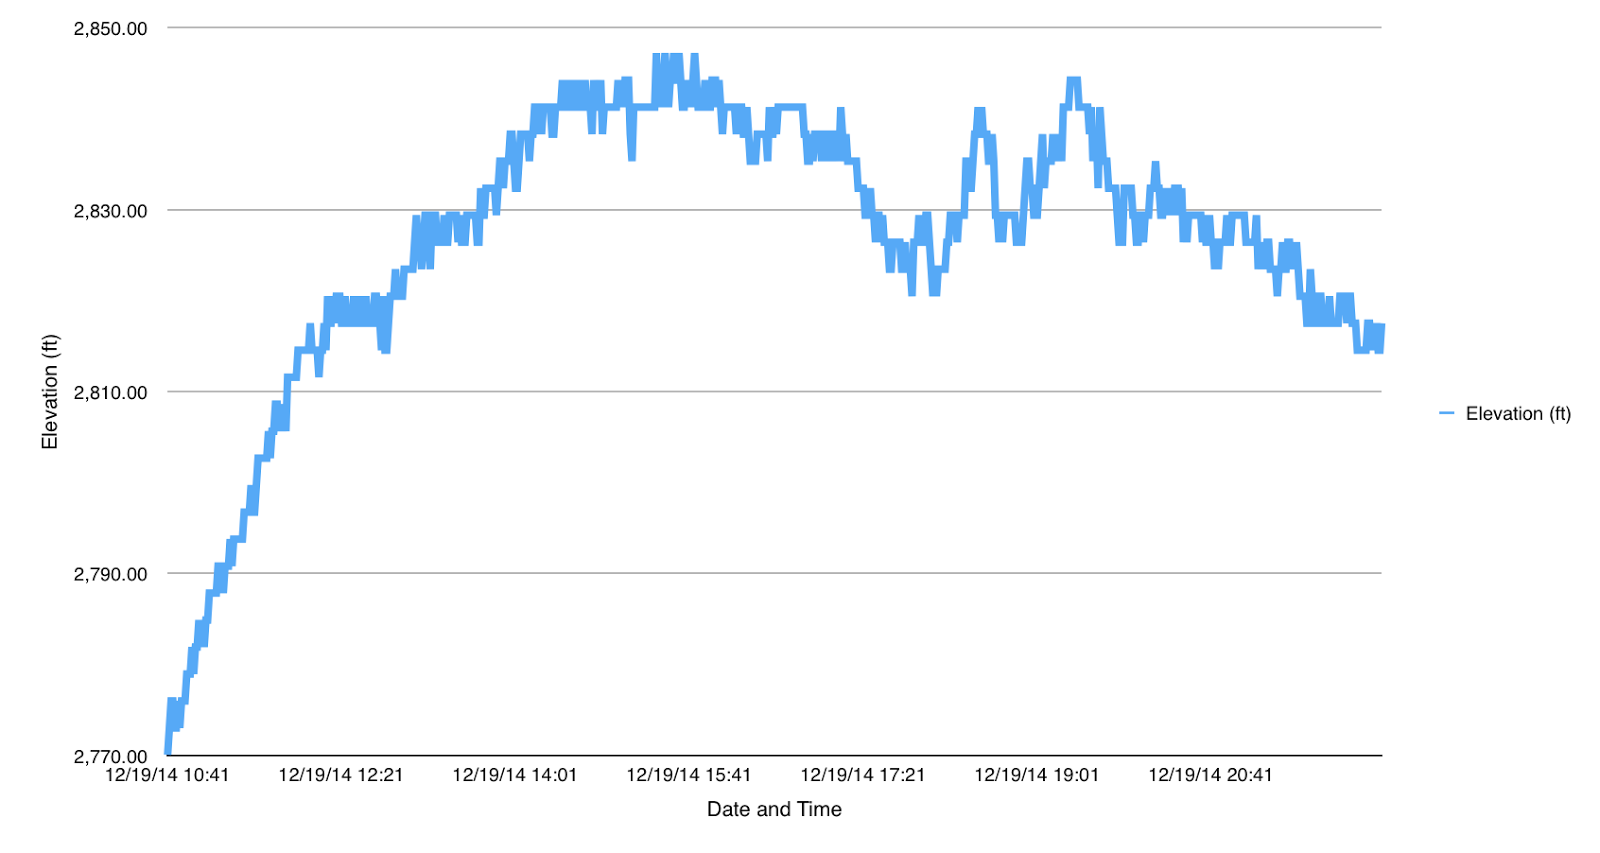
I was quite surprised that there was a shift of almost 80 feet over the day. It made the 22-foot shift from the other day look pretty good. The last time I checked the seismic activity in Las Vegas, it was pretty low, so this got me thinking =].
Barometric Pressure Records
I figured there had to be a history of barometric pressures. A few minutes on Google and I found a website that records the barometric pressure at major airports for a one week period and displays a graph. When I compared my 12-hour log with McCarran International Airport – the airport in Las Vegas, where I live – my graph matched theirs. Here is a screen shot of the last seven days at McCarran International Airport.
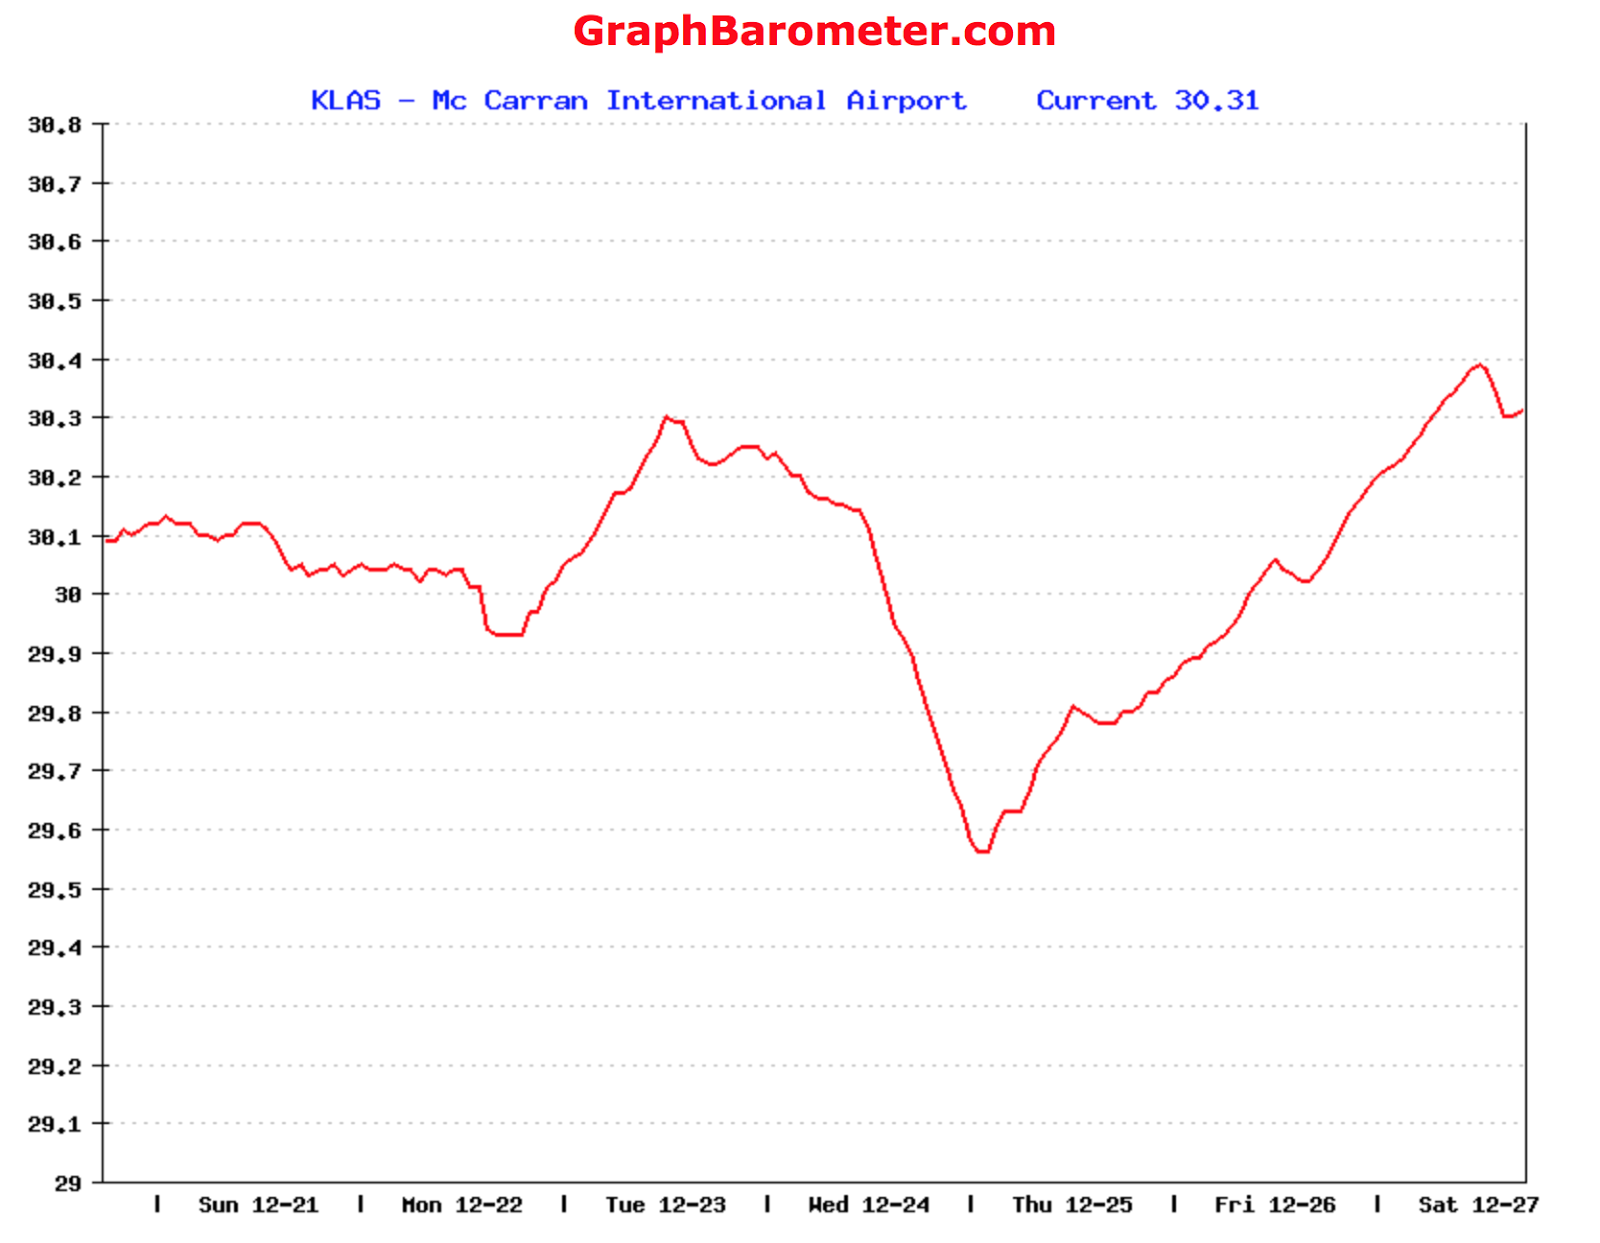
This graph shows a shift in elevation of over 700 feet. That’s a massive difference.
The Meteorologist
I needed a bit of help. A good friend from university is a special type of energy trader. He’s one of the smartest guys I know. Luckily for me, he hired a meteorologist to work on his team. I reached out to my friend and the meteorologist and I ended up exchanging a few emails.
During our discussion, he mentioned that it’s easy to see a shift in elevation of 60 feet. A source he referenced mentioned that this shift is commonly up to 150 feet. This is still a lot better than the 700 feet I saw in Las Vegas, but still not great. Even if you correct with temperature and humidity, you are still likely to see a 15-foot variance.
What Now
The meteorologist recommend a combination of things I could try in an attempt to get more accurate elevation data. He brought up the idea of using GPS, barometric pressure, temperature, humidity, and high-resolution topographic maps. I like the idea but ultimately it may be a bit overkill for what I am doing. Regardless, I will have to find a way to get an elevation that is accurate enough for my research.
Next Up
Next week I should have an update on mounting the logger and sensors to my bike. It’s time to get handy in the garage.

Co-founder at FLO Cycling. Jon manages the day to day operations and acts as the lead engineer for all FLO products.