
Legacy Article: The data discussed in this article is taken from our previous generation of wheels.
In Part 1 of this series, we looked at the aerodynamic drag created by different tires on a front FLO 60 Carbon Clincher wheel. As many of you know, when searching for the fastest tire, aerodynamic drag is only half of the equation. In order to know how much power is required to rotate your tire, you must also consider it’s rolling resistance. Only when you combine the wattage required to overcome both the aerodynamic drag and the rolling resistance, can you tell which tire is the fastest.
To calculate the rolling resistance generated by each tire, we sent our box of tires to Tom Anhalt from Blather ’bout Bikes. Tom is a well respected engineer, and a wealth of knowledge on all things cycling. Tom has his own rig for testing rolling resistance, and it was perfect for our application. After Tom was finished calculating the rolling resistance of each tire, he calculated the total wattage each tire consumed.
Let’s get to the numbers!
Step 1: Calculating Rolling Resistance
To calculate the rolling resistance values below, we used the following test procedure.
- – Bike Speed 35km/h or 21.75mph
- – Wheel load 45kg or 99.21lbs
- – Rolling resistance numbers were measured on a Mavic Open Pro wheel at 120 psi. *
* Tom noted the following: “I’ve found that the Crr on the (smooth) rollers of a tire the Mavic Open Pro wheel at 120psi, is approximately equivalent to the Crr on a 21mm internal width wheel at 100psi.”
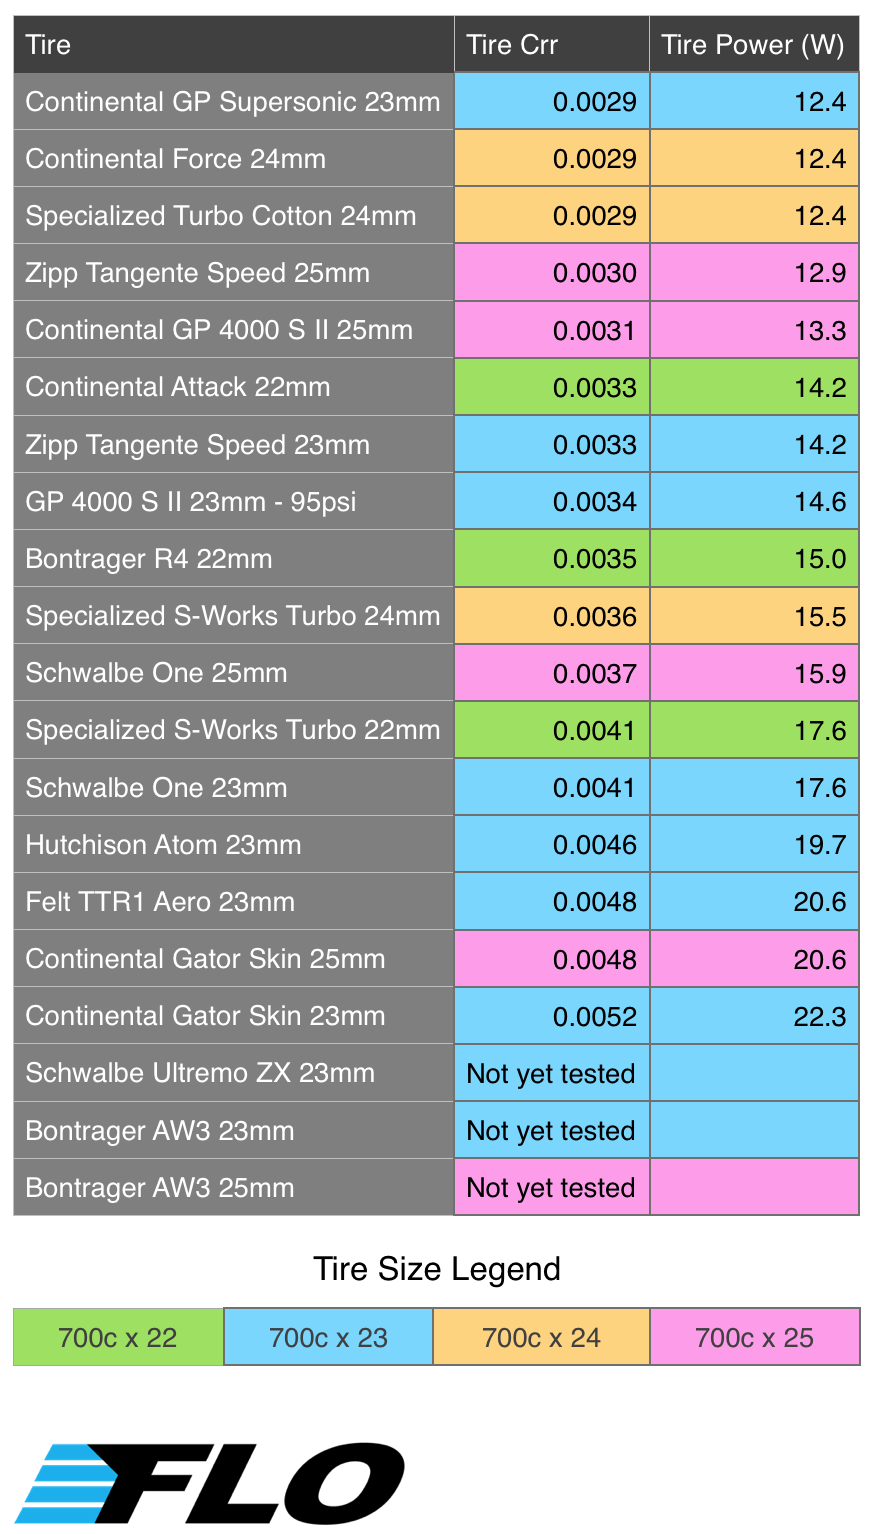
Below are the rolling resistance values and the power to overcome that rolling resistance for each tire. They are listed in order from fastest to slowest.
Step 2: Combining Aerodynamic Drag, and Rolling Resistance
For each value plotted on the graph, a tire’s aero drag and rolling resistance values were converted to Watts and added together. This combined value represents the total wattage required to power the tire.
Note: When combining the both the aerodynamic drag values from Part 1 of this series and the rolling resistance values, it is important to note that beta correction of the data was completed by Tom. Tom’s Beta correction calculation assumes that the ambient wind is at 90deg to the direction of travel (pure crosswind) for the resultant yaw angle for a given bike speed.

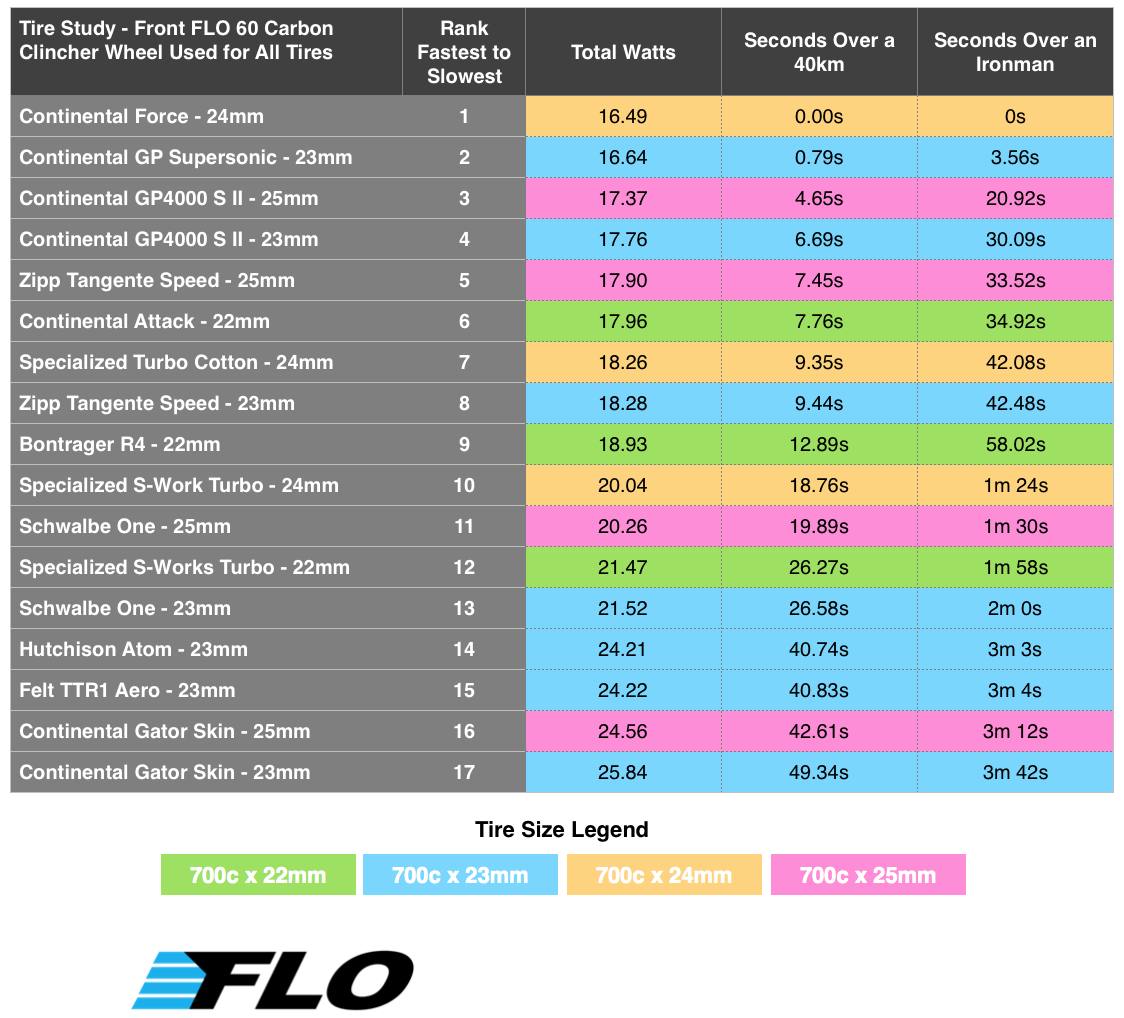
So what does all of this data mean? Which tire is truly the fastest? At FLO we have developed a Net Drag Reduction Value (NDRV) formula that gives a cyclist a realistic estimate of how much time a wheel will save them in the real world. This formula was developed using the 110,000 real world data points we collected in our 5 step design process. Since we know how much time a cyclist spends at each yaw angle on average, our NDRV formula can calculate a weighted average power value across all yaw angles. In the table below, we have listed the tires from fastest to slowest based on the numbers generated by our NDRV formula. Keep in mind that the lower the power number, the faster the tire. Wattage numbers are for one individual tire.
I hope you have enjoyed this article. Please leave your comments and questions below. I’d like to say a special thank you to Tom for all of his help with the Crr data.

Co-founder at FLO Cycling. Jon manages the day to day operations and acts as the lead engineer for all FLO products.