
In Part 1 of this series, we are going to look at the effect tires have on aerodynamic drag. The first time we visited the A2 Wind Tunnel back in April of 2011, we were shocked by how much of a difference tires could make. We always wondered how much better our results could have been if we had the budget to test a long list of tires.
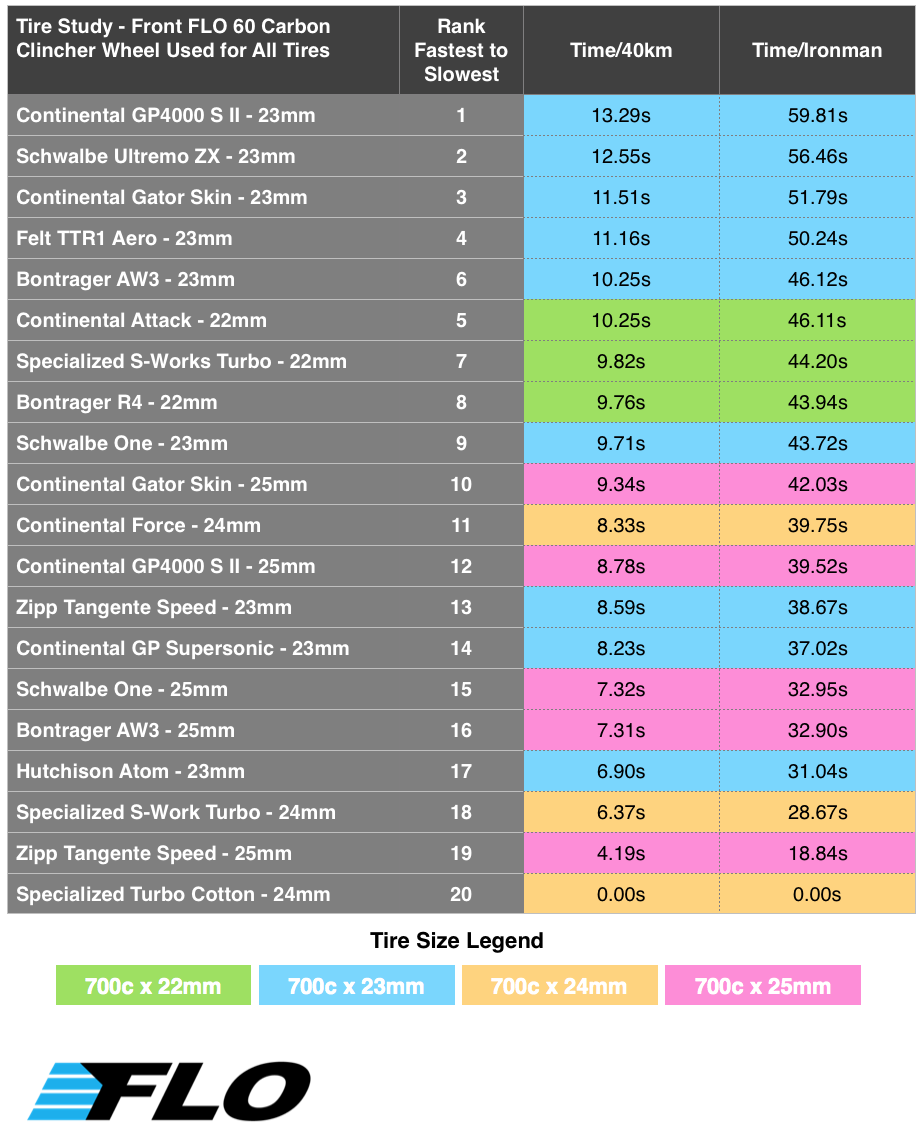
In November of 2015, four and a half years after our first round of testing, Jon and I went back to the A2 wind tunnel with our new 2016 wheel line. During our two day visit, we conducted what is rumored to be the largest tire study to ever take place at the A2 Wind Tunnel. In total, we tested 20 different tires on our new FLO 60 Carbon Clincher to get an accurate look at how tires effect aerodynamics.
What Will Be Covered in Part 2
Aerodynamic drag is only part of the tire equation. On top of overcoming the aerodynamic drag created by your tire, you also have to overcome it’s rolling resistance while riding. A tire that has a low aerodynamic drag, could have a high rolling resistance. When you combine the two components, the tire as a whole would be a poor performer. Tires that have the best combination of aerodynamics and rolling resistance are the best tires to use while racing.
I sent Tom Anhalt the majority of the tires we tested in the A2 Wind Tunnel to test on his rollers. In Part 2 of this series, we will combine both aerodynamic drag and rolling resistance to find the best overall tire.
For now, let’s focus on the results of the aerodynamic testing.
The Test
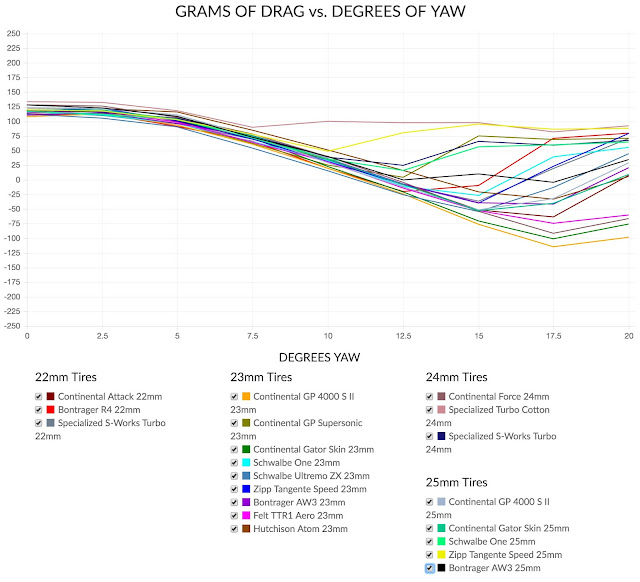
Below are the parameters of the aerodynamic drag test performed at the A2 Wind Tunnel. We used the parameters listed below to eliminate as many variables as possible.
– Wind tunnel wind velocity was set to 30mph.
– All tires were tested on the same FLO 60 Carbon Clincher.
– Tire pressure was set to 95psi and calibrated with a digital pressure gauge.
– Drag measurements were recorded at 0, 2.5, 5.0, 7.5, 10.0, 12.5, 15.0, 17.5, and 20.0 degrees of yaw.
– At each yaw angle, two measurements were taken and averaged.
– Tare was measured and removed from the results.
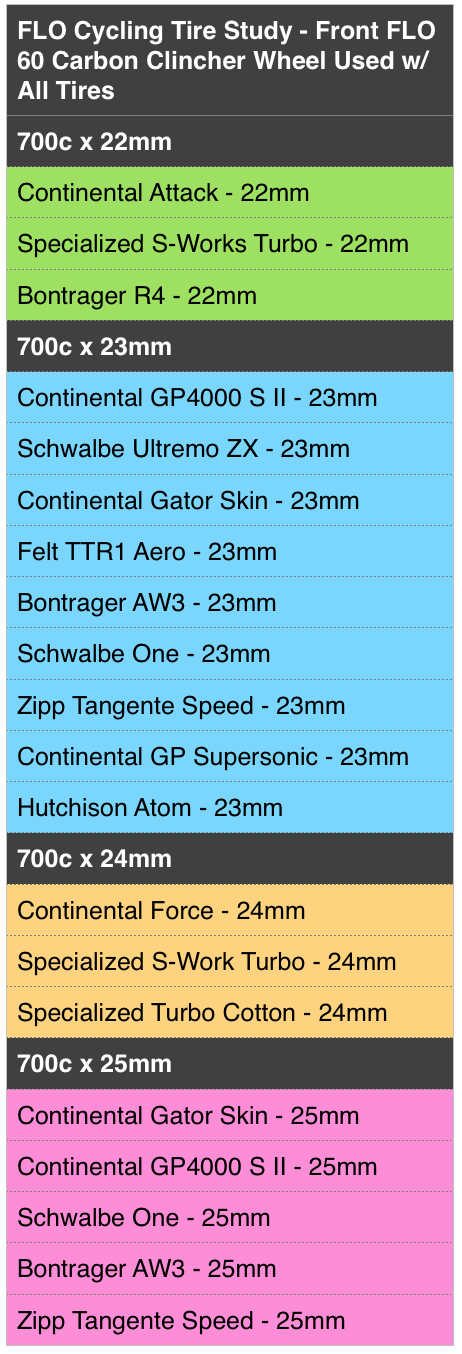
The Tires
* Listed tire sizes are based on the manufacturer’s naming conventions. Please keep in mind that a tire’s width may not measure as stated when on a rim. For example, a 23mm tire may measure 26mm in width when installed on a rim. Please keep this in mind when selecting tires for your frame.

Co-founder at FLO Cycling. Jon manages the day to day operations and acts as the lead engineer for all FLO products.