
LEGACY ARTICLE: This article shows CFD work done on our first generation FLO Wheels
CFD Results For Cycling Wheel Profiles
I wanted to take a minute and put up a few shots of the computational fluid dynamics (CFD) data we are getting back. The results for the 60mm fairing are in and we are waiting for the 90mm shape.
First of all, I think these look really cool, but maybe it’s the engineer in me. To clarify, we are modeling the tire, rim, and fairing only. We did not model the spokes or hubs. We tested two unique fairing shapes. I am going to wait to post the numbers until we get the results from the wind tunnel. The wind tunnel tells no lies. What I can tell you is we are getting negative drag (lift) on our 60mm deep fairing. At this point I can assume our 90mm wheel will also return negative drag (lift) values. Keep in mind these are modeled without the spokes or hubs so our drag is bound to increase to some degree. Regardless it’s looking very promising.
We are running our tests from 0-20 degrees of yaw at winds speeds ranging from 5-30 mph. To generate all of our results will require running a computer 24 hours a day for 21 days straight. I was blown away when I heard this. Below is an email our CFD Engineer sent us. It helps explain why we need 21 days.
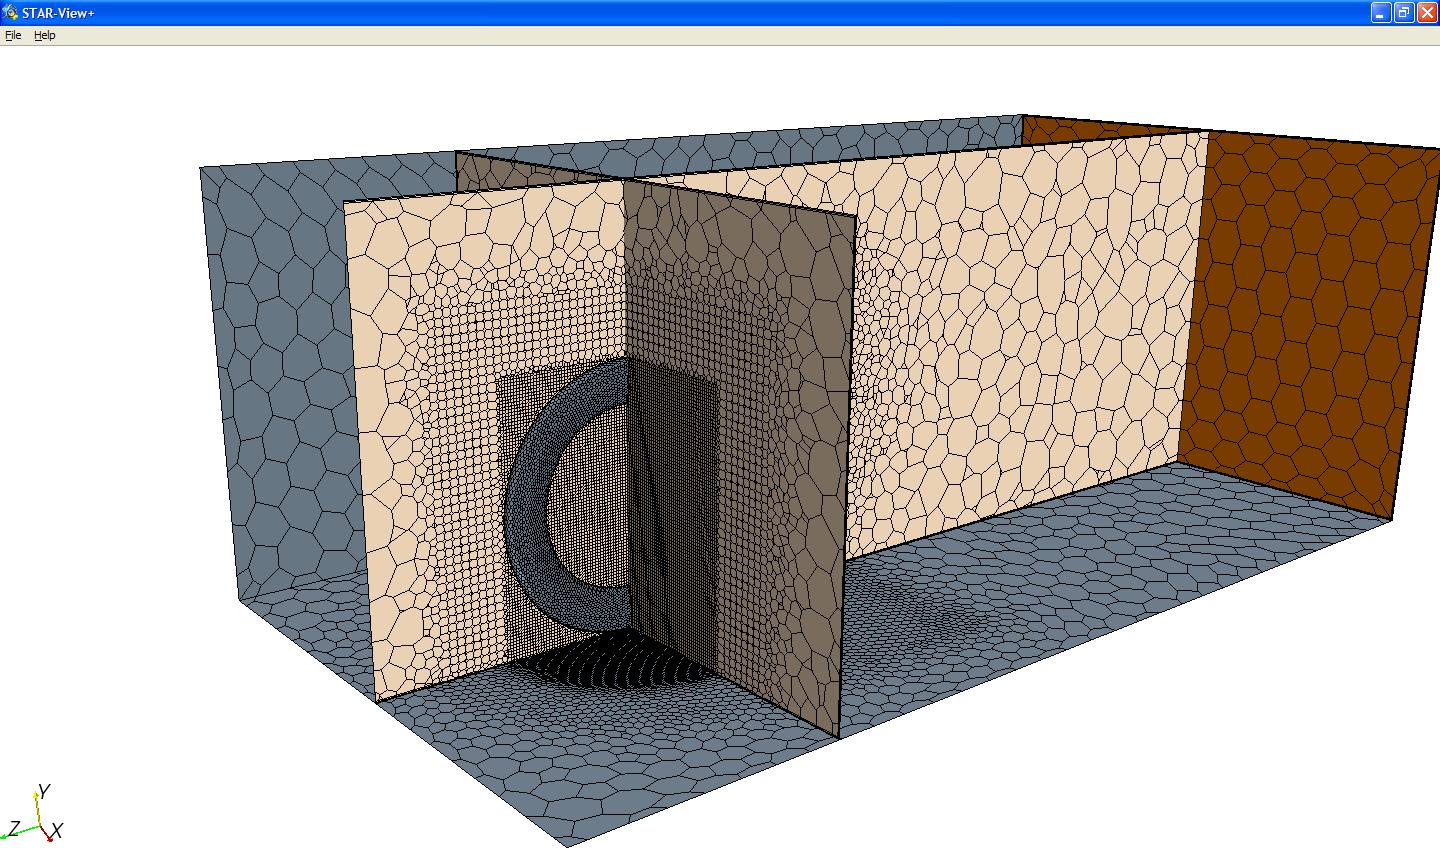
CFD works by splitting the region of interest (air volume around the wheel) into a number of cells. In our case there are approximately 1.4-1.6 million cells. Results are computed in each individual cell for each iteration. Results are then sent to the neighboring cells and taken in from neighboring cells. It does this for each iteration in order to reach (in our case) a steady state solution. It takes about 260 iteration to reach a good answer. This is the most (near) perfect mesh I’ve actually ever created.
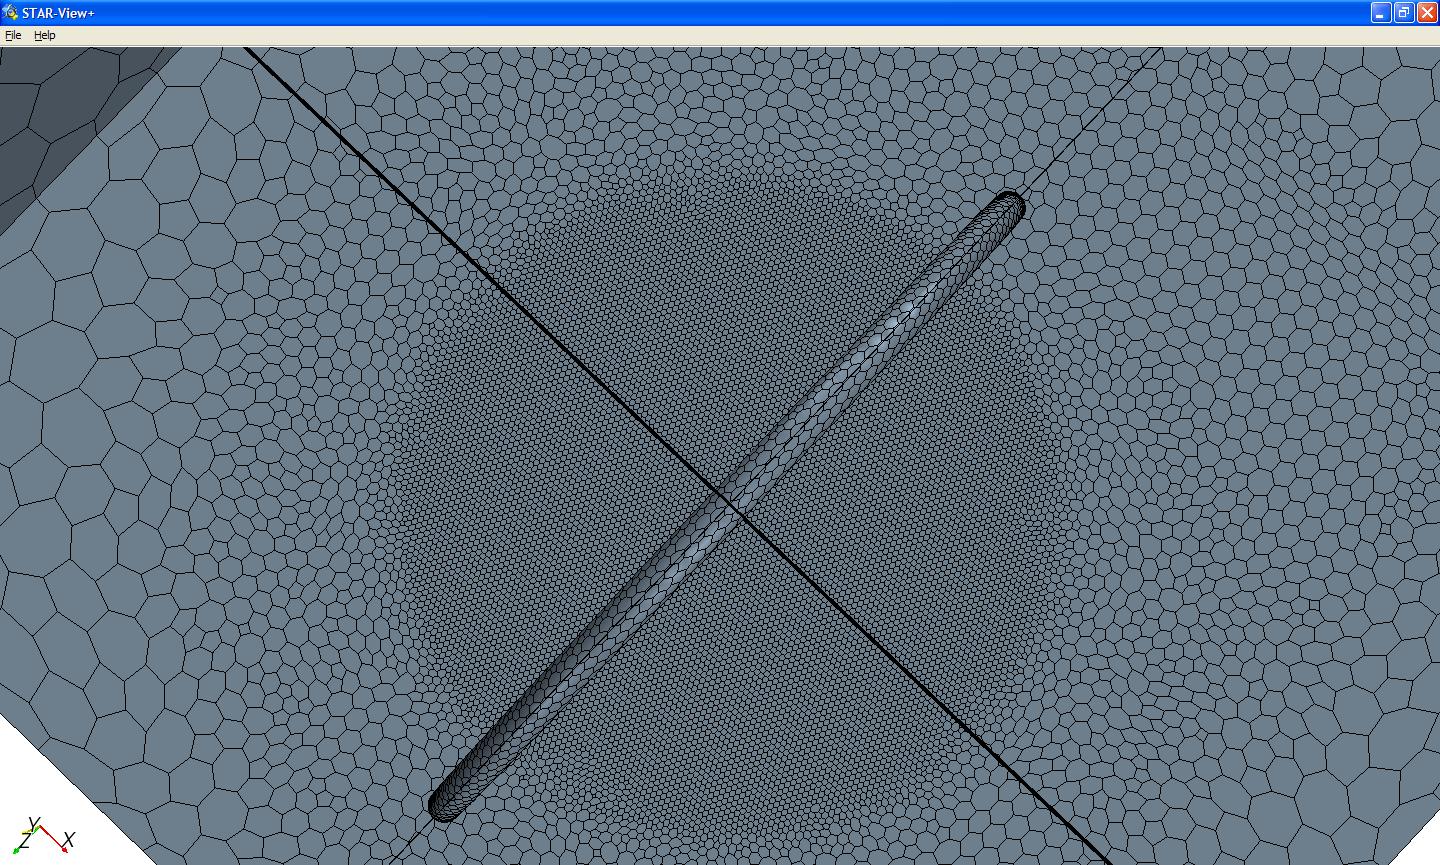
Cycling Wheel Polyhedral Mesh
The first few pictures show the polyhedral mesh (the cells talked about above) for one of the wheel shapes.
 |
 |
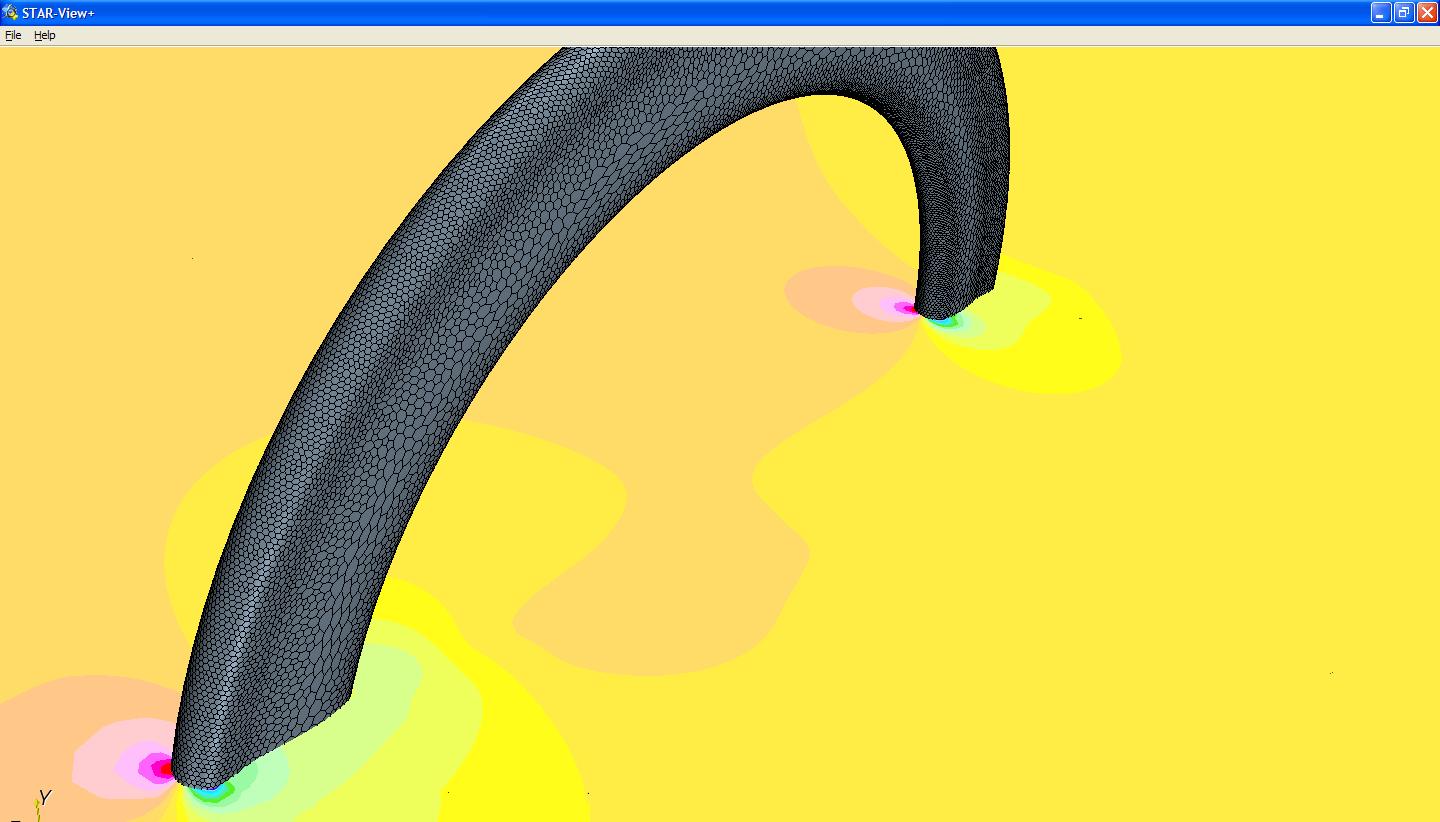
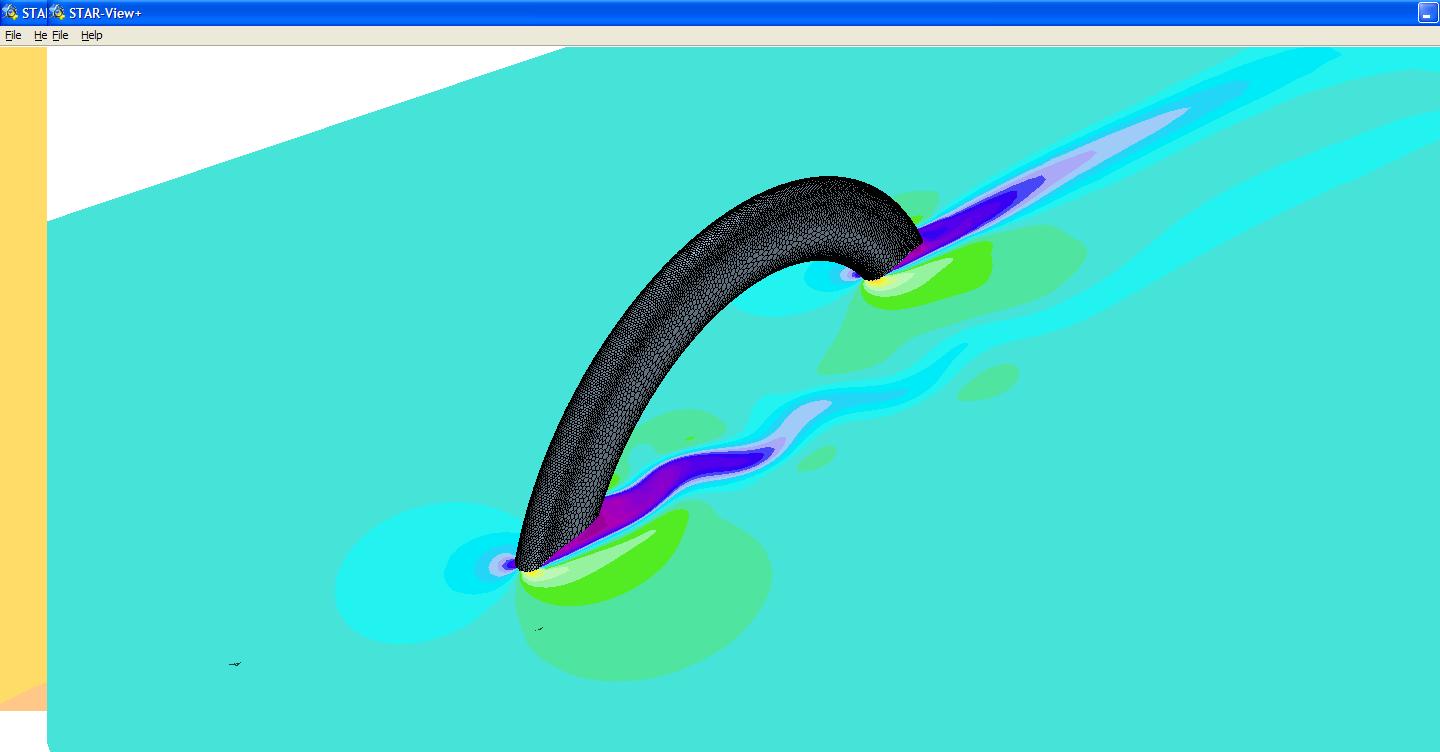
Pressure Build Up On Cycling Wheel
The next shot shows the buildup of pressure around the leading edges and the negative pressures on the trailing edge of the tire and fairing.
 |
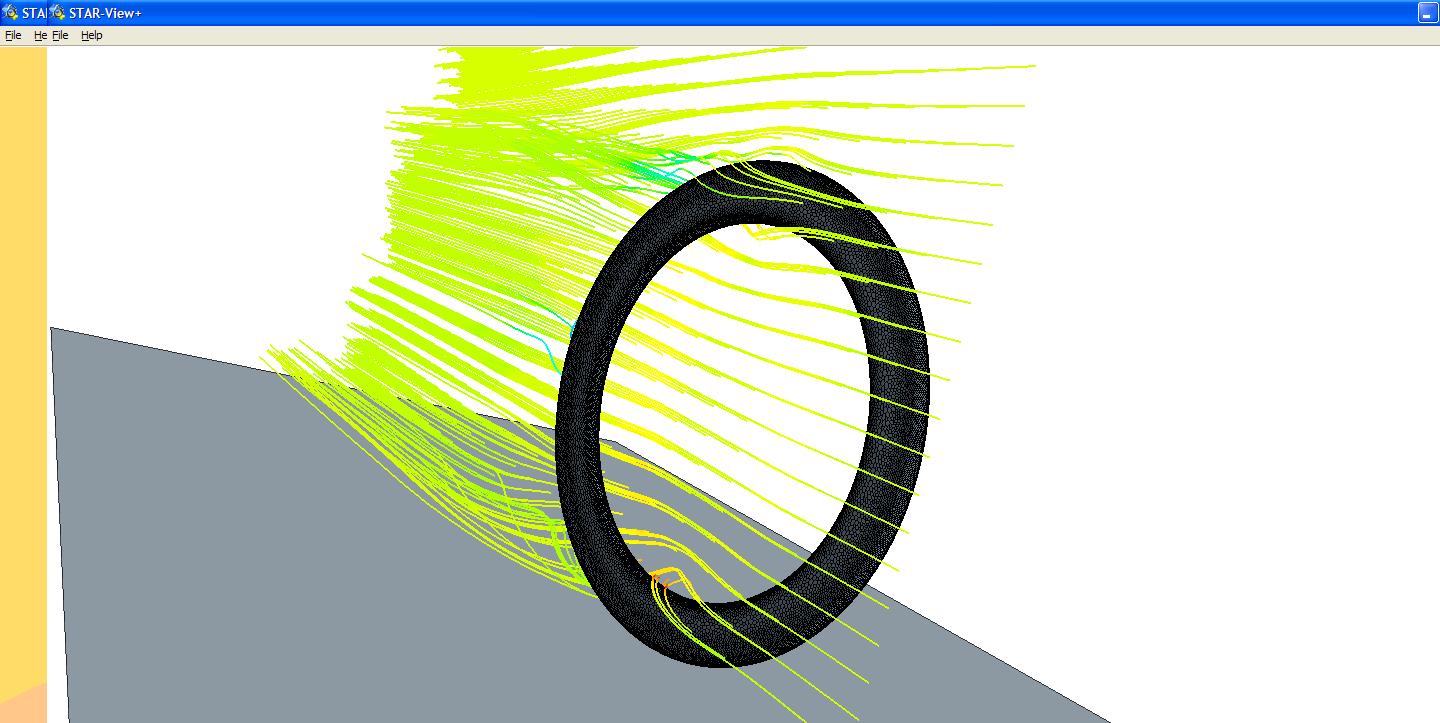
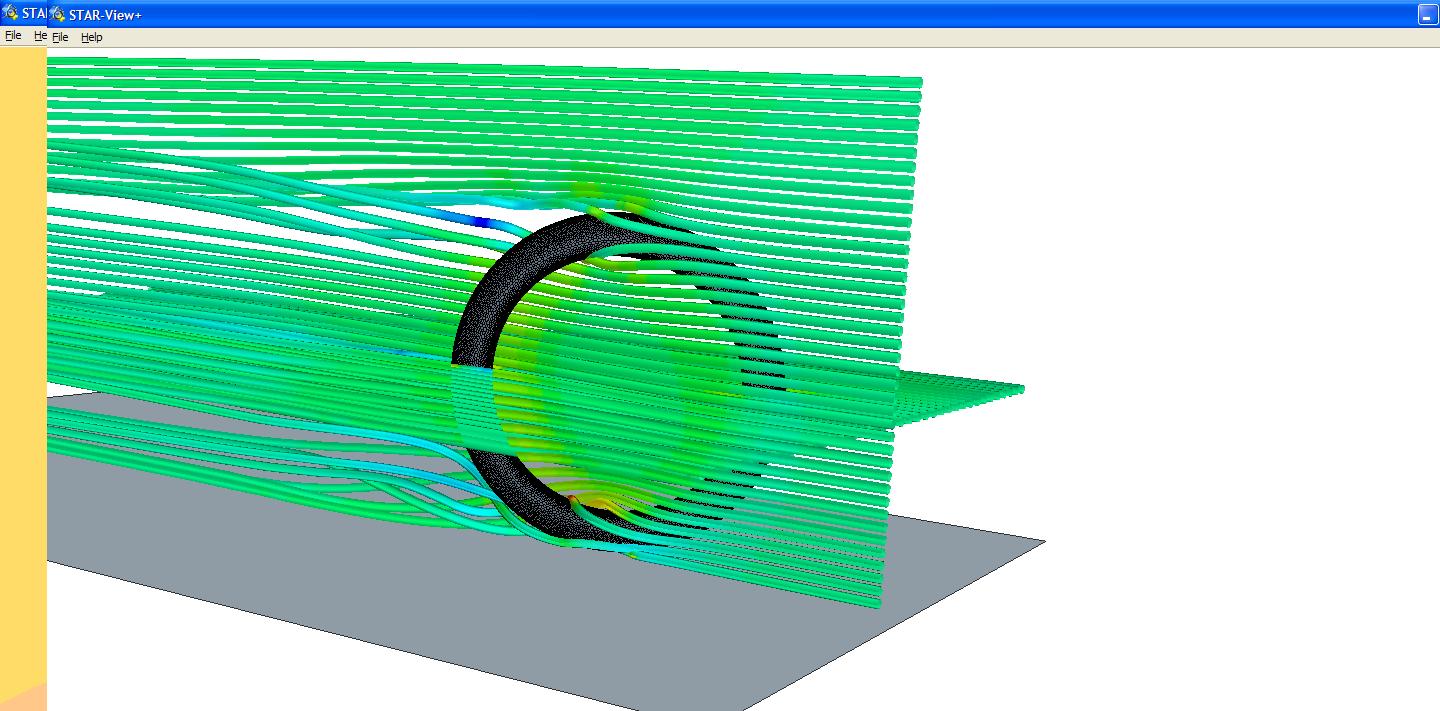
Velocity Streams
Lastly here are a few shots of velocity streams around the shape.
 |
 |
 |
I hope you enjoyed this as much as I did. For more great content, please register for our free monthly newsletter at the top of the column on the right. We send links to all the articles we post during the month. Let me know if you have any questions. I’d love to answer them if I can.

Co-founder at FLO Cycling. Jon manages the day to day operations and acts as the lead engineer for all FLO products.